VictoriaMetricsCloud
Deploy and run VictoriaMetrics stack instances while we manage them for you. Predictable pricing with Capacity Tiers designed to reduce costs
No credit card required
Managed metrics and logs for any Observability stack
Prometheus, OpenTelemetry, and beyond!
Our products
Open source at the core — every product is built for performance, efficiency, and simplicity at any scale
What you get
Everything you need for production-grade observability – fully managed

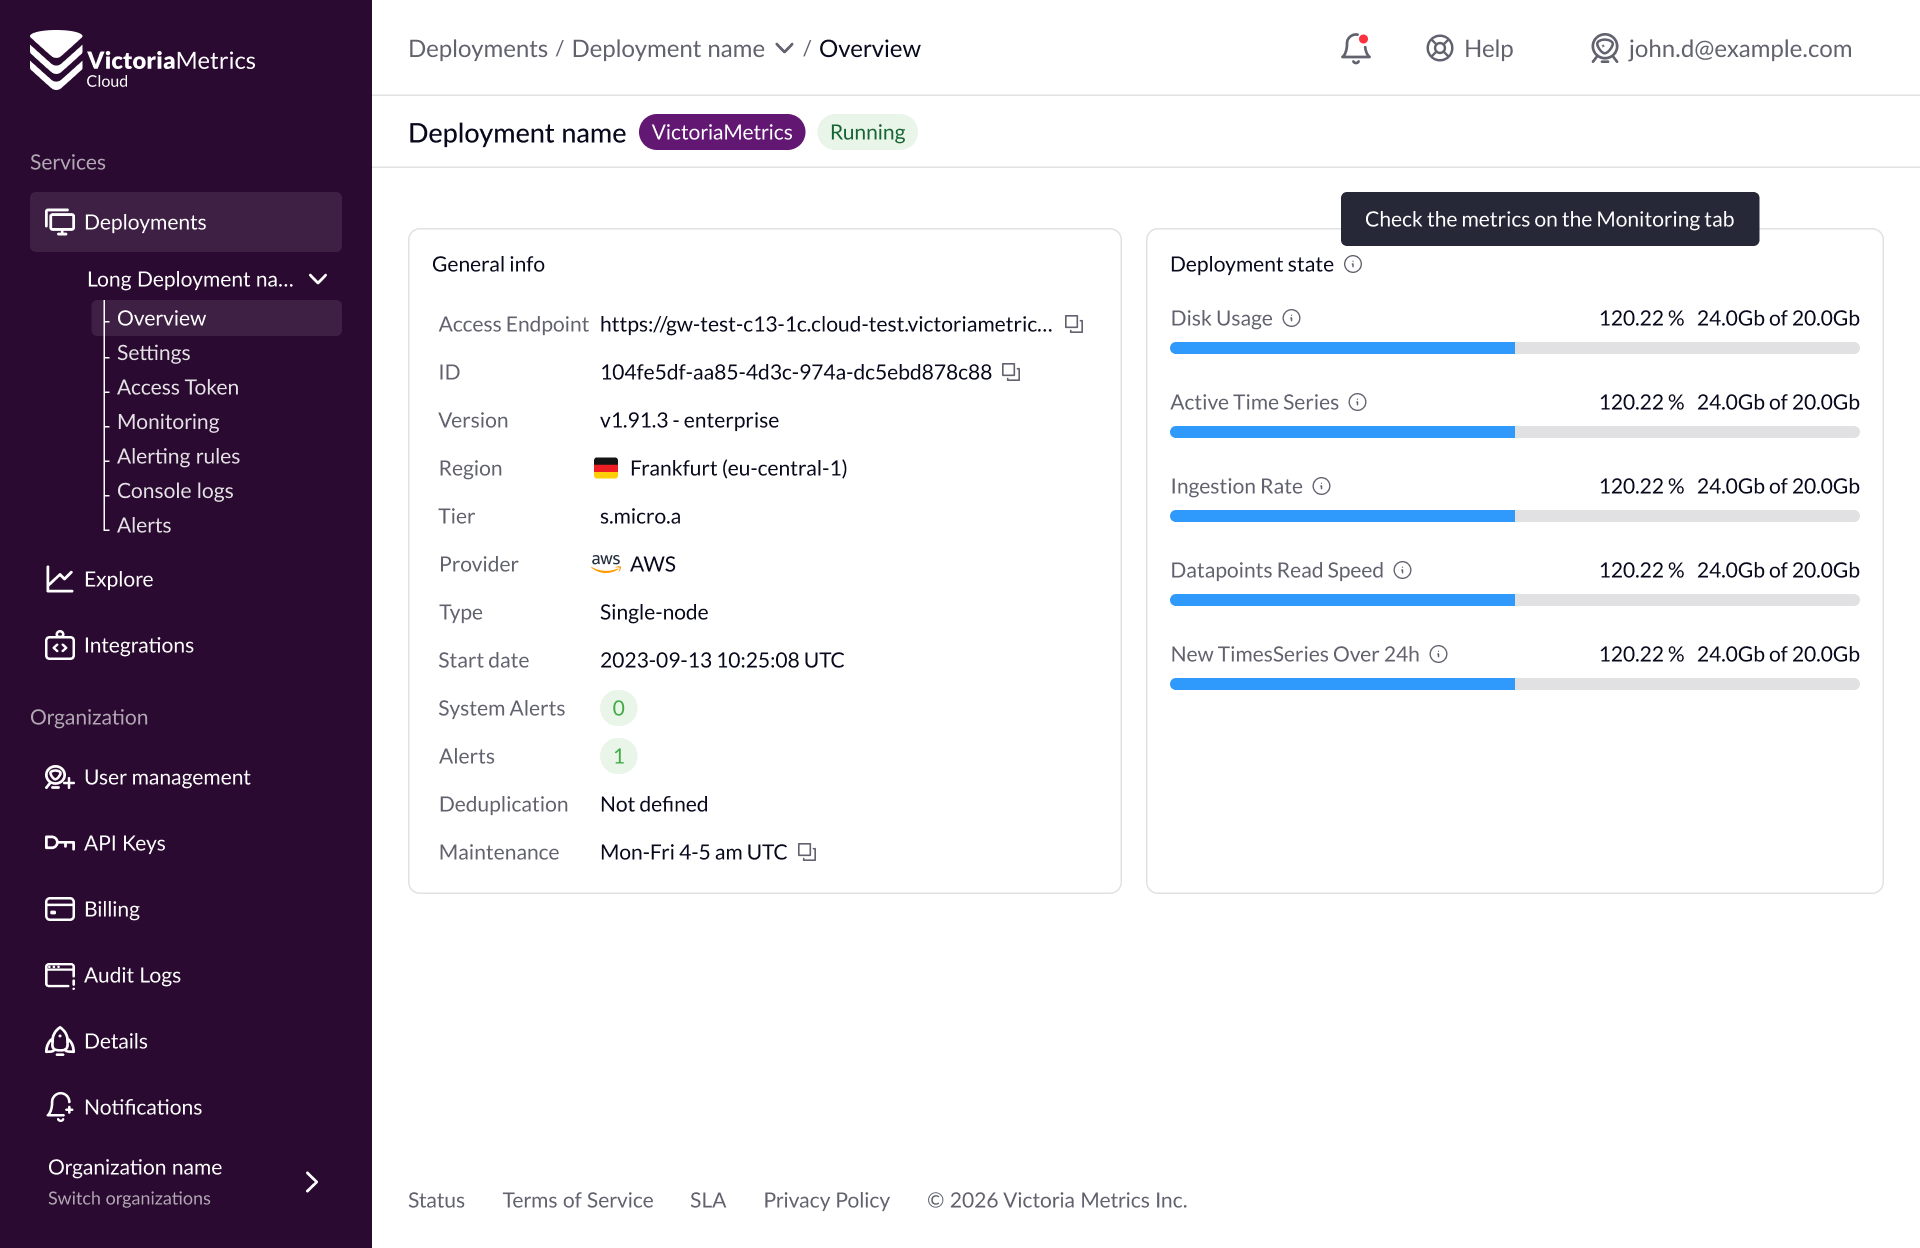
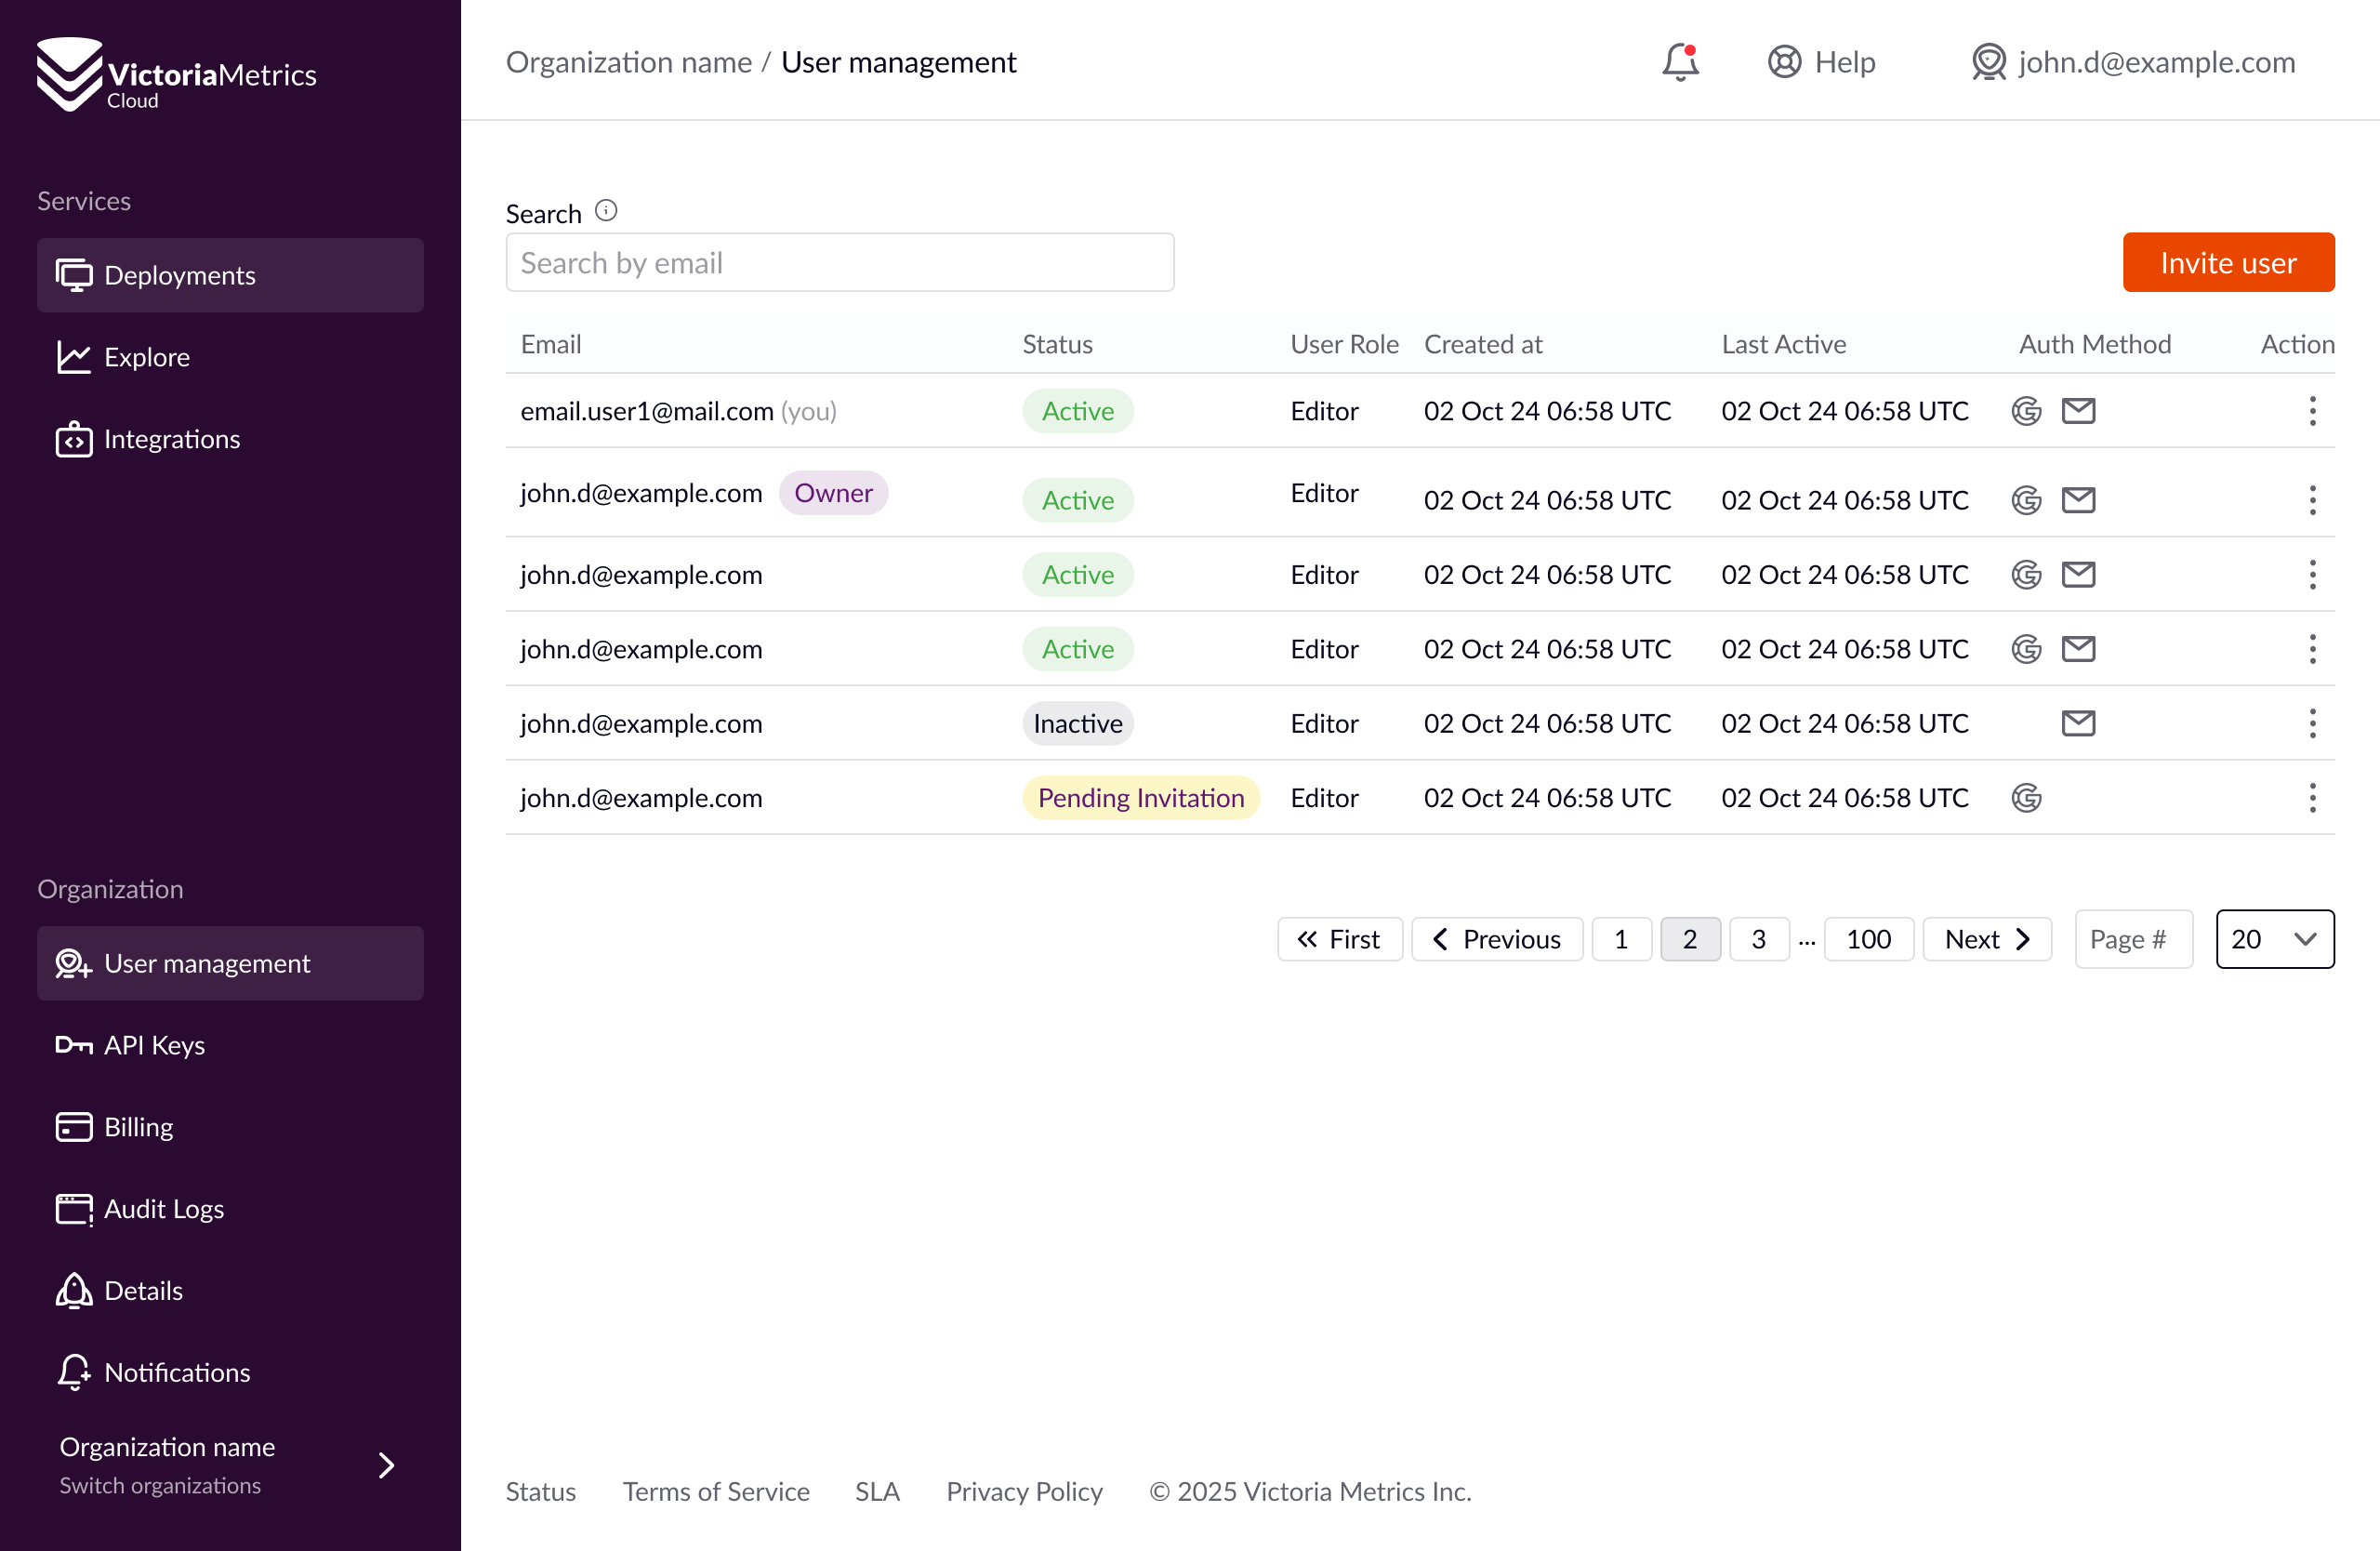
Managed deployments
Single-node or Cluster mode — provisioned, patched, and monitored by us. Focus on your data, not infrastructure

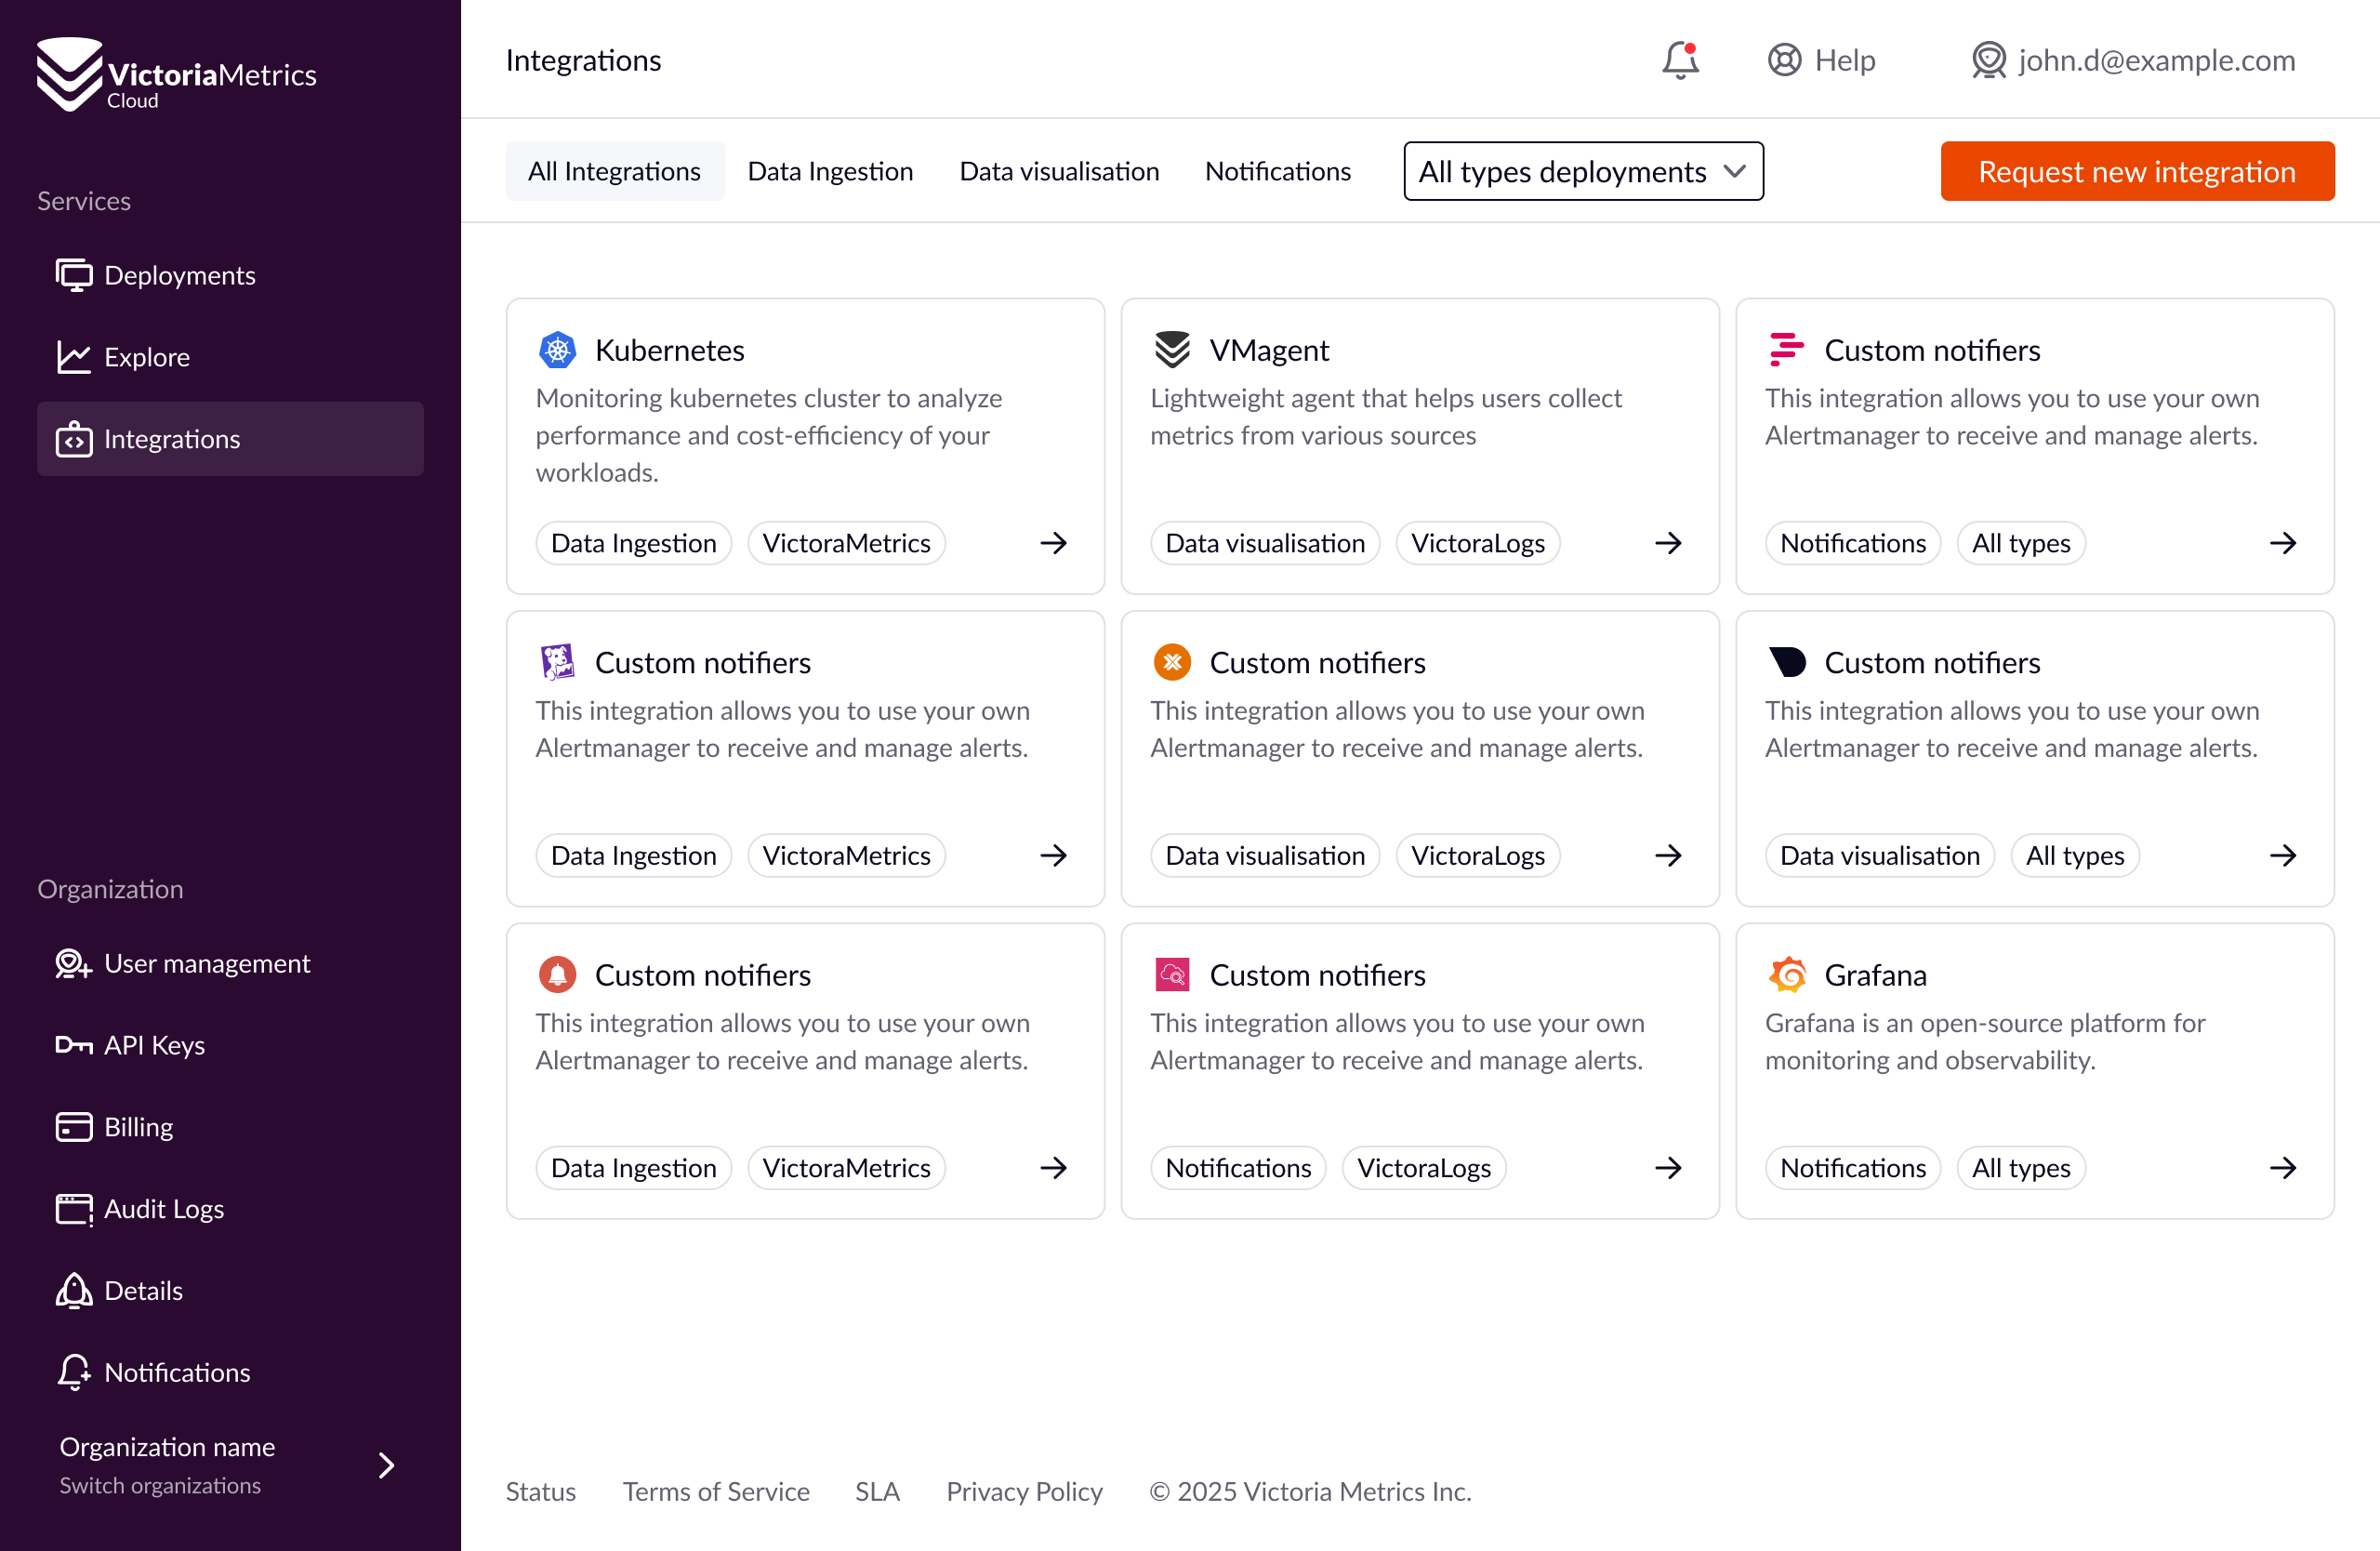
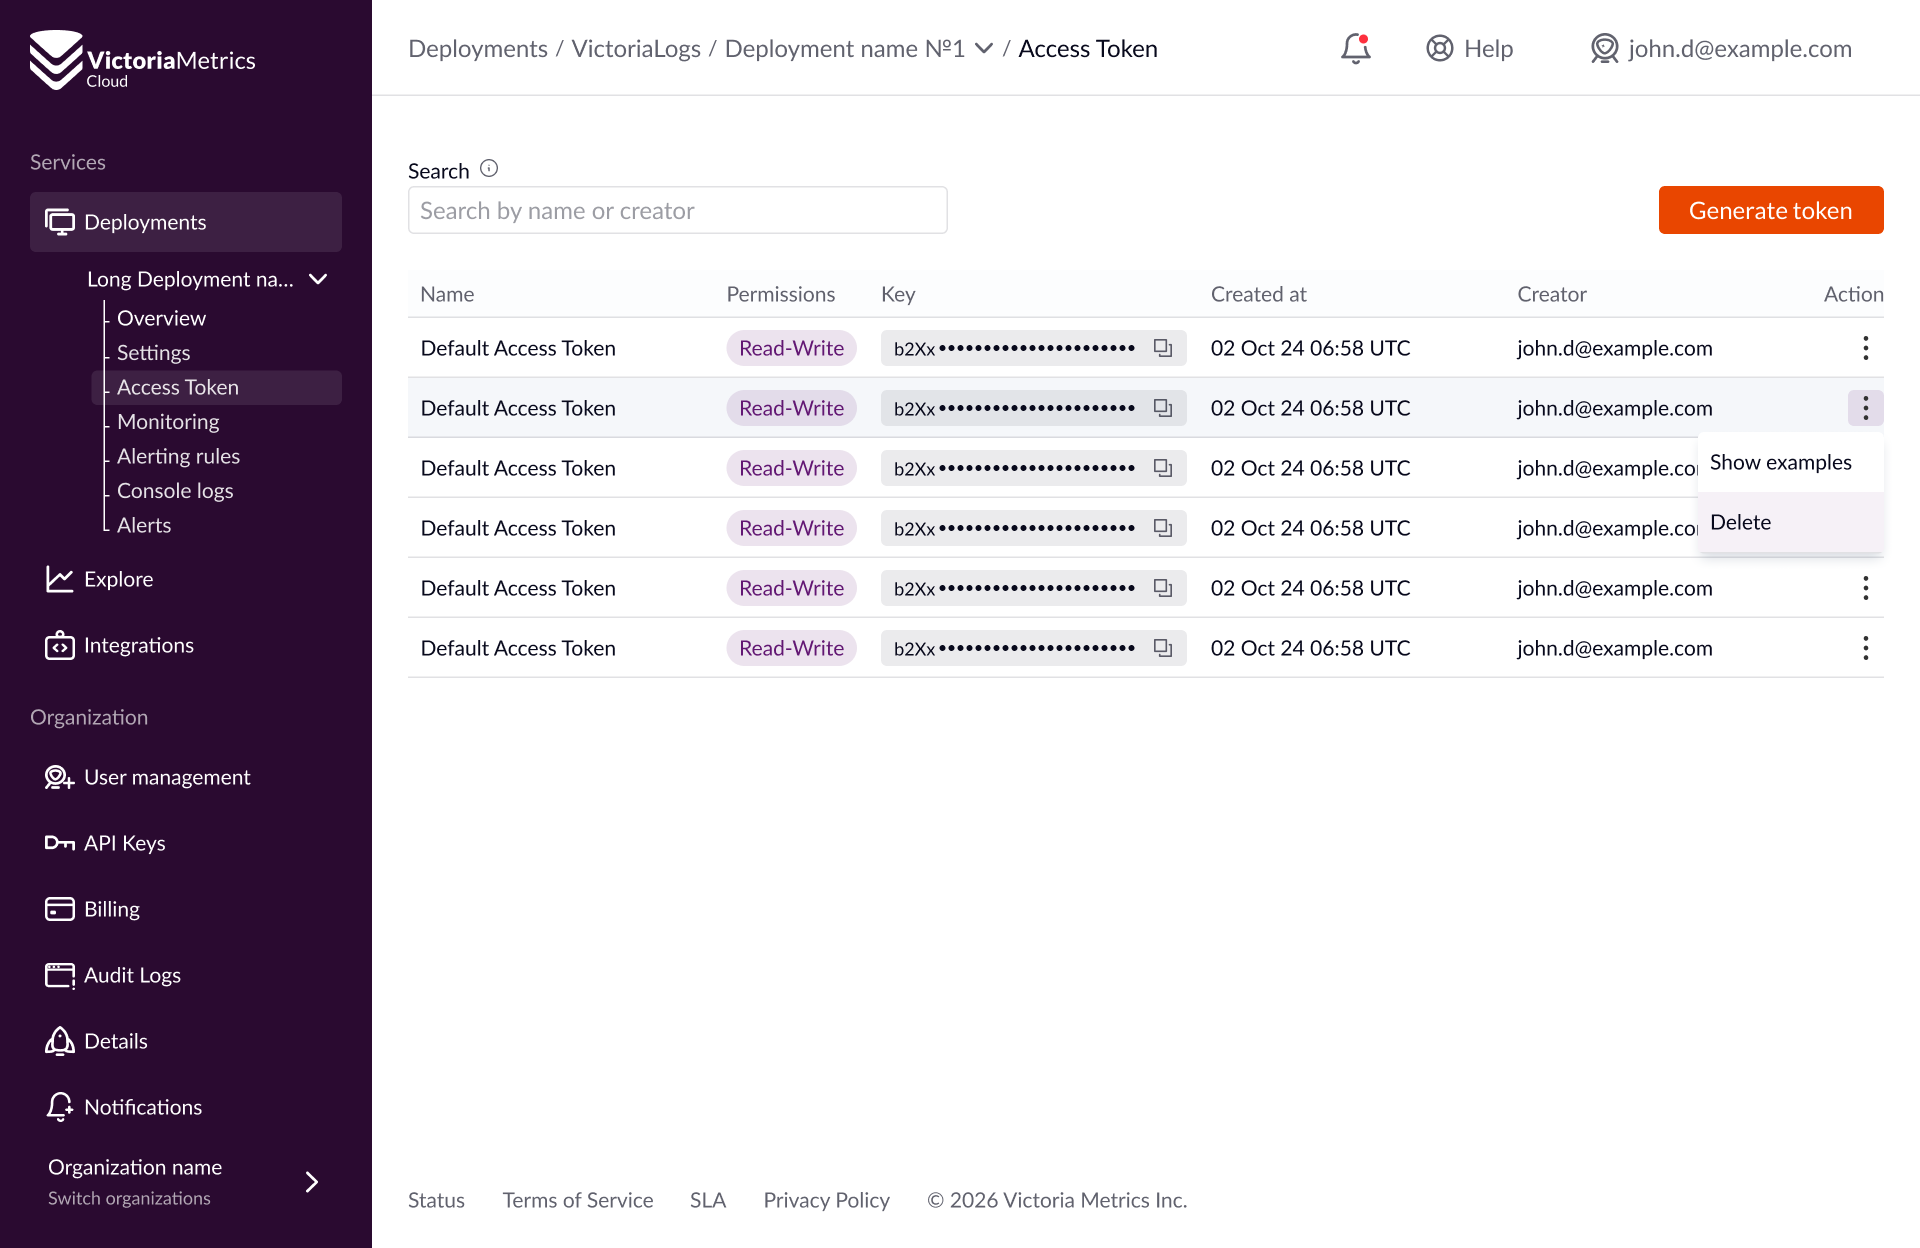
Connect anything
Prometheus, OpenTelemetry, Kubernetes, Grafana, CloudWatch, and more — all you need is a URL and an access token

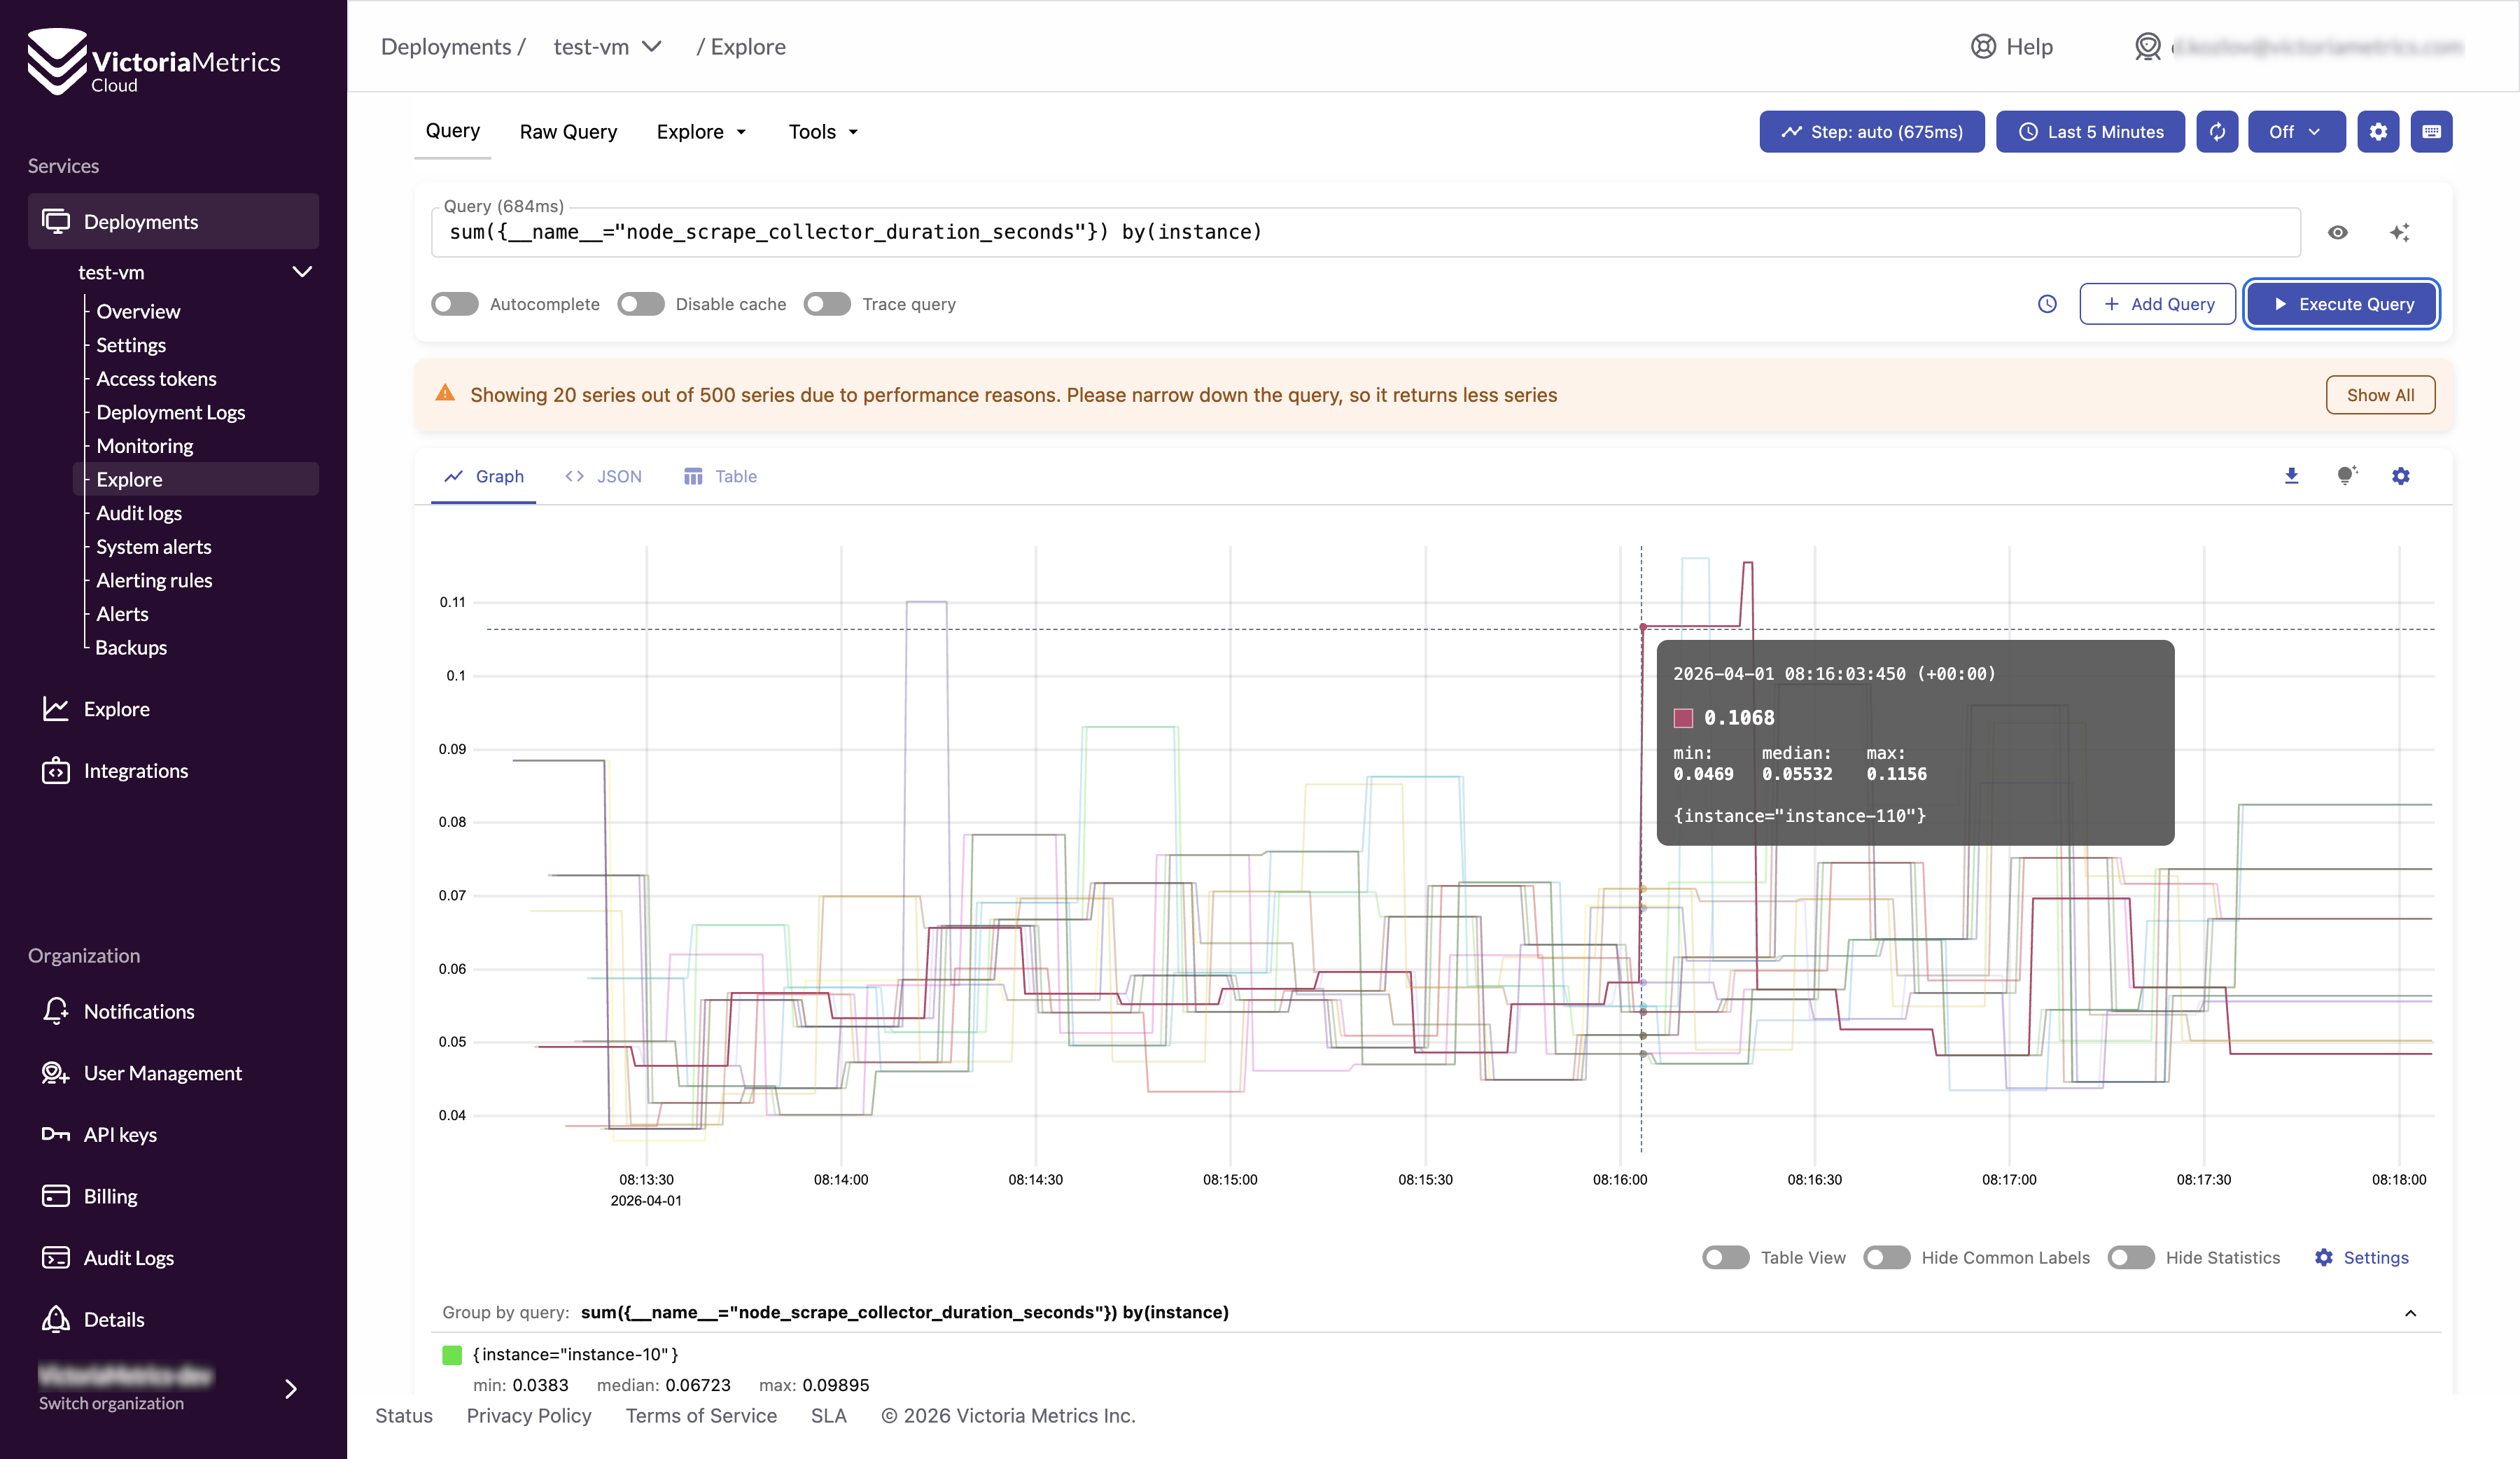
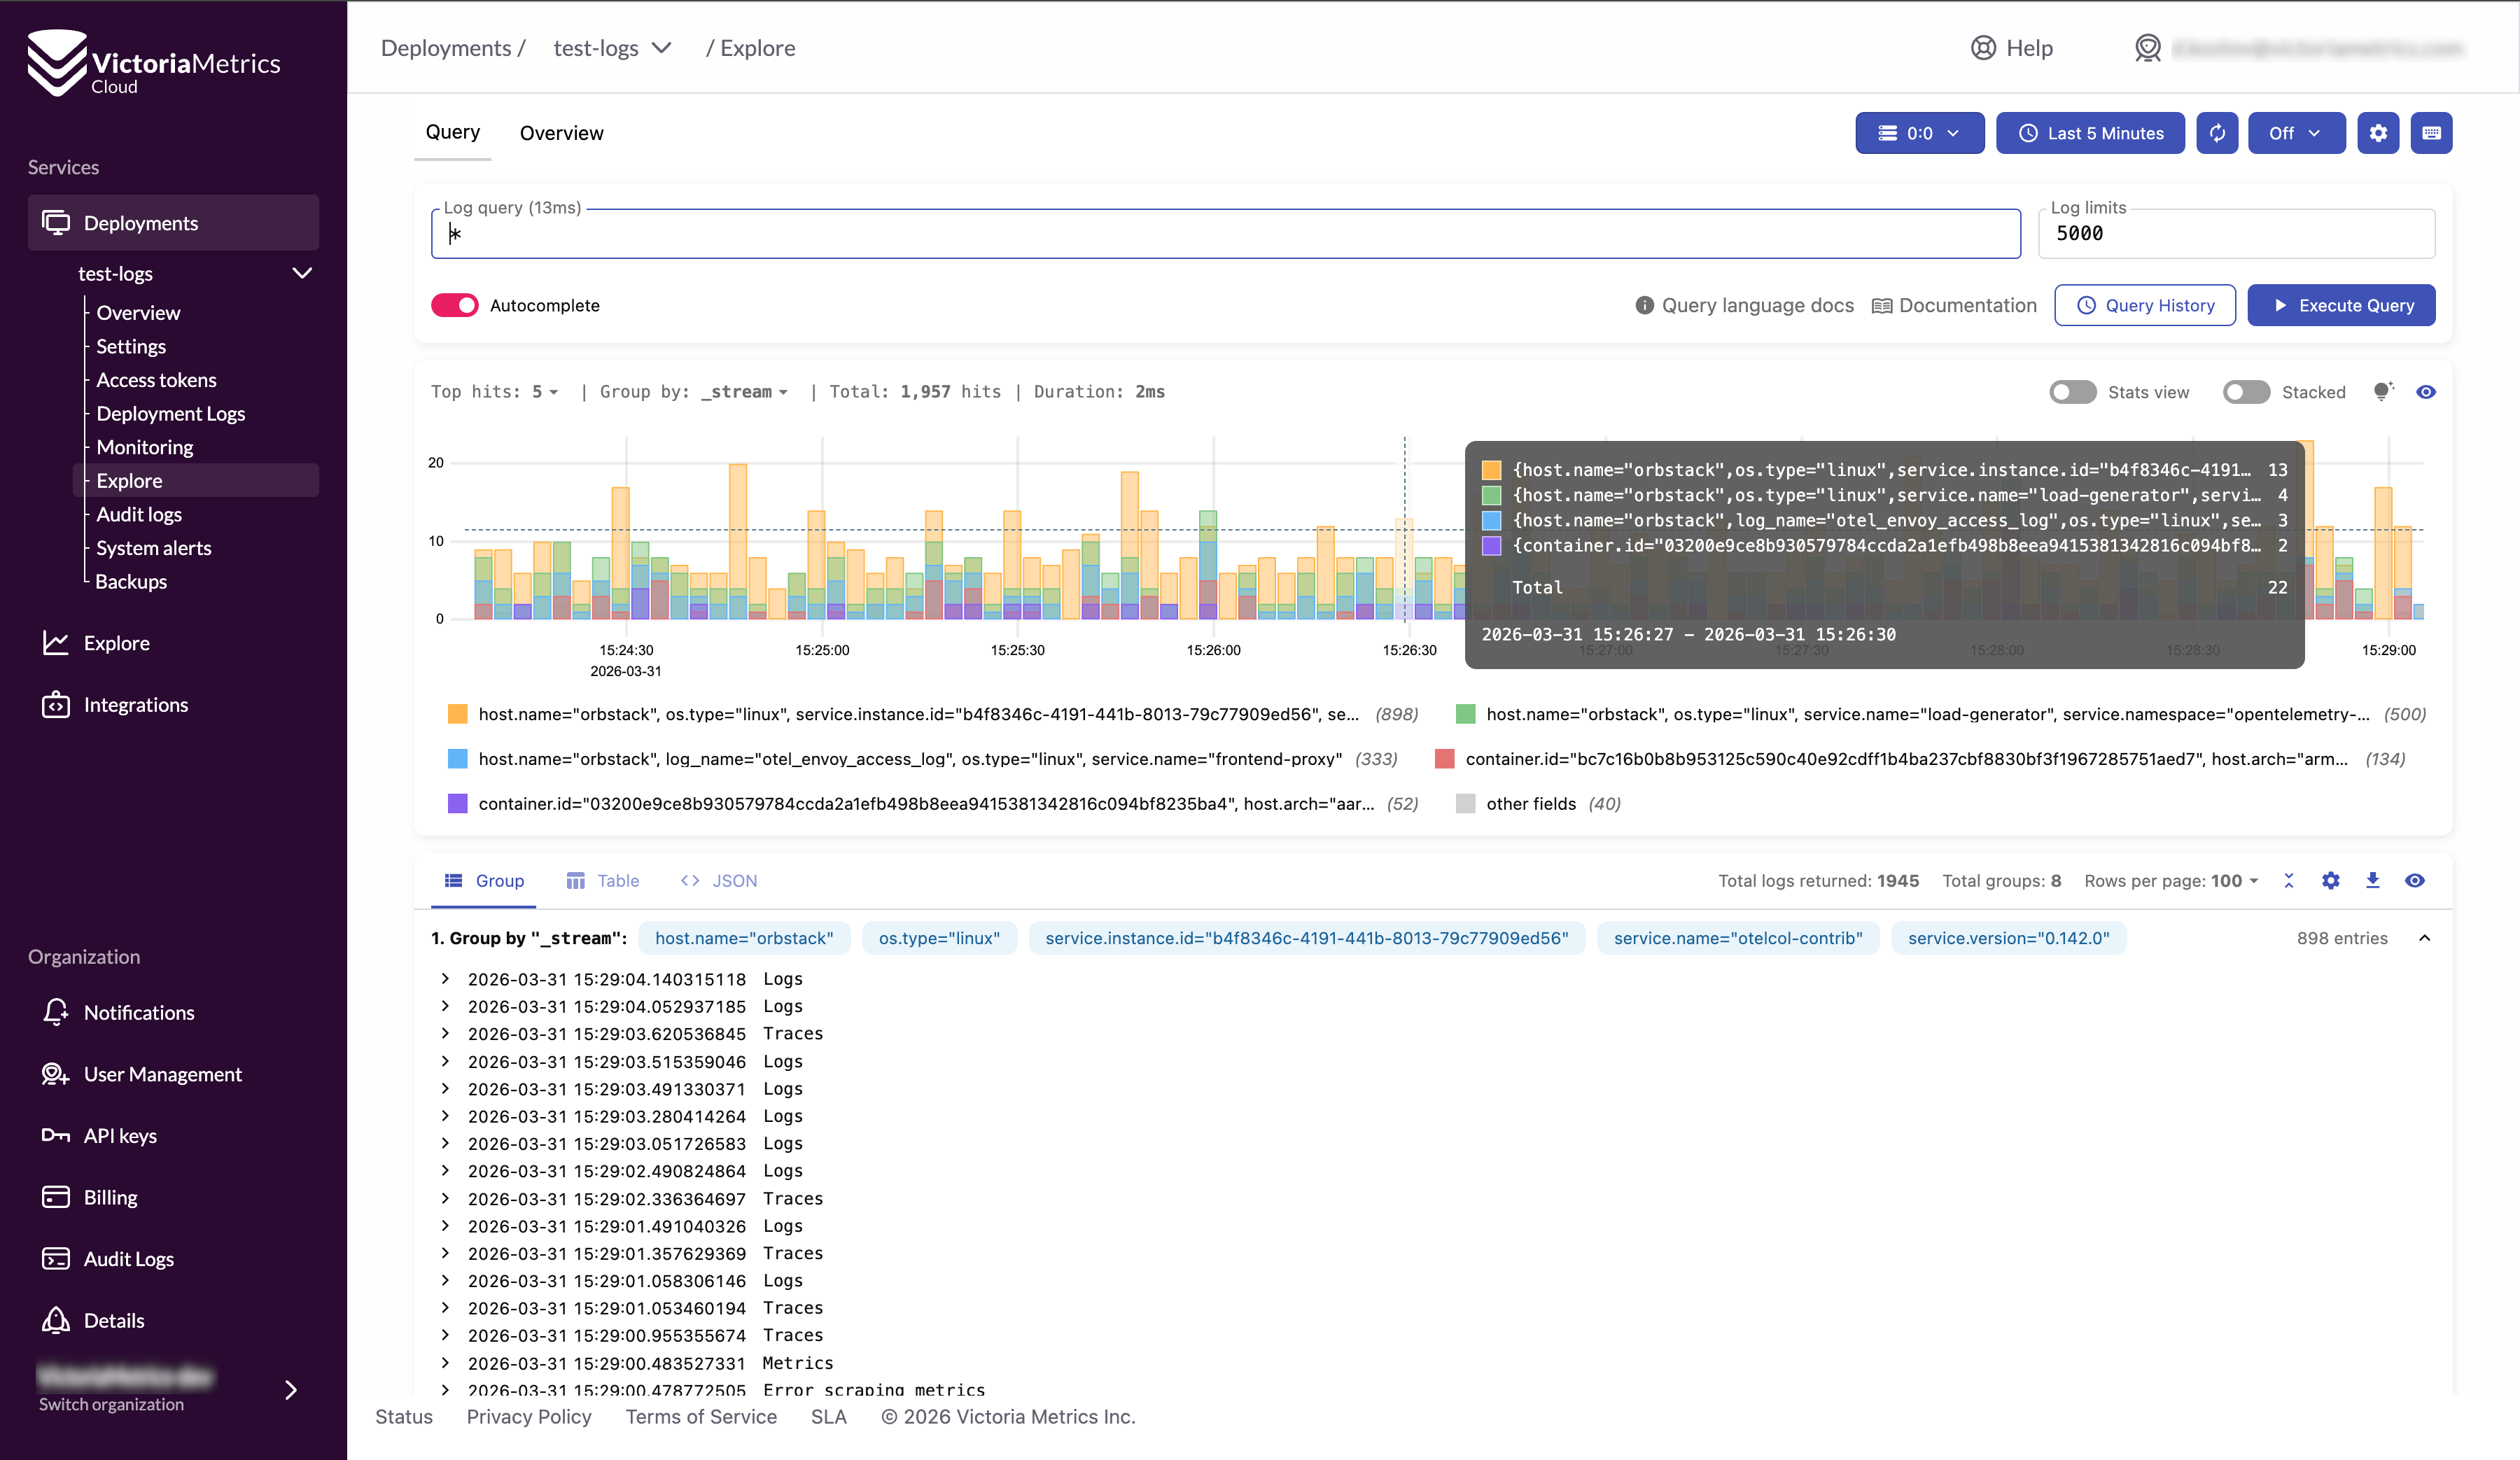
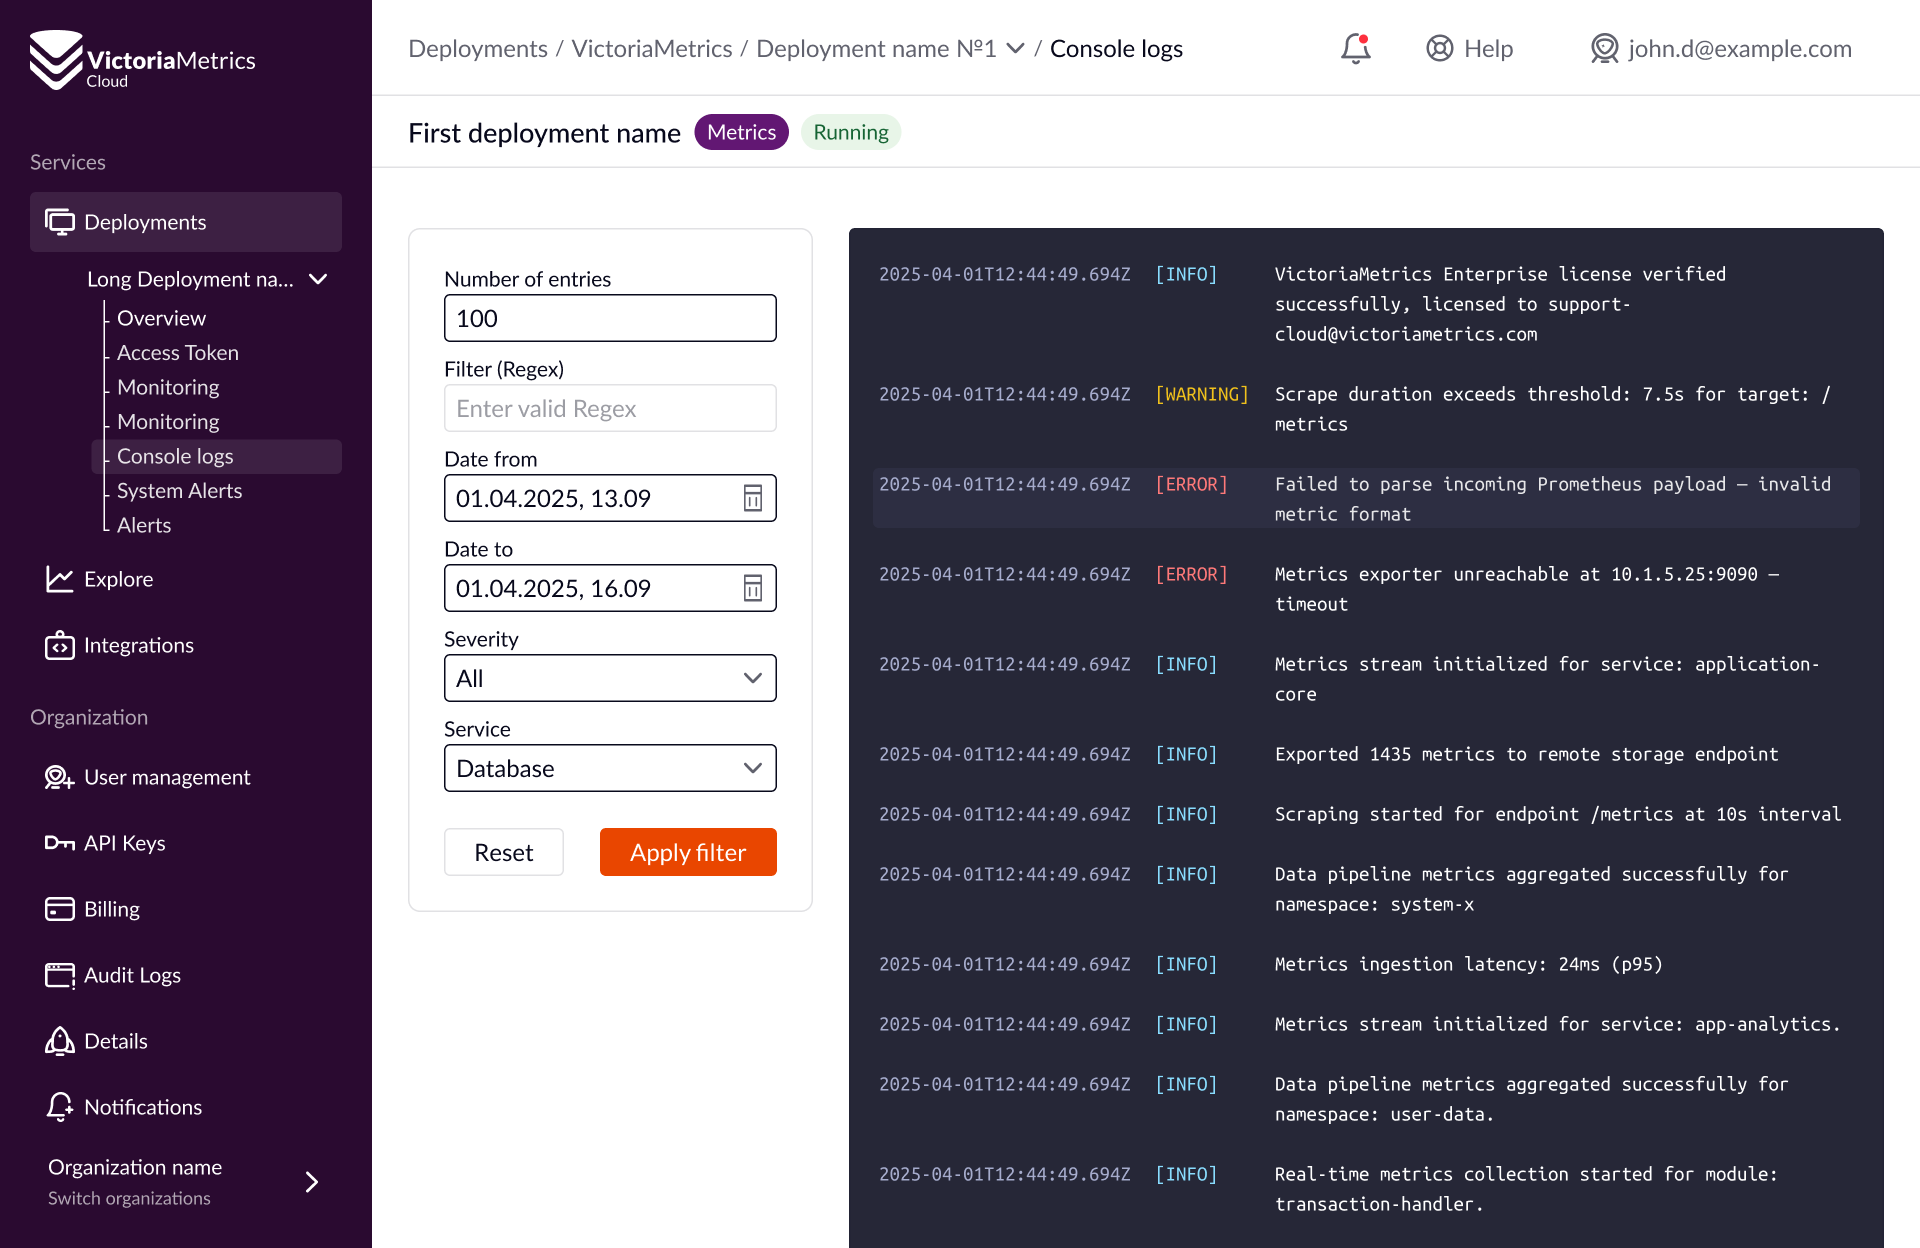
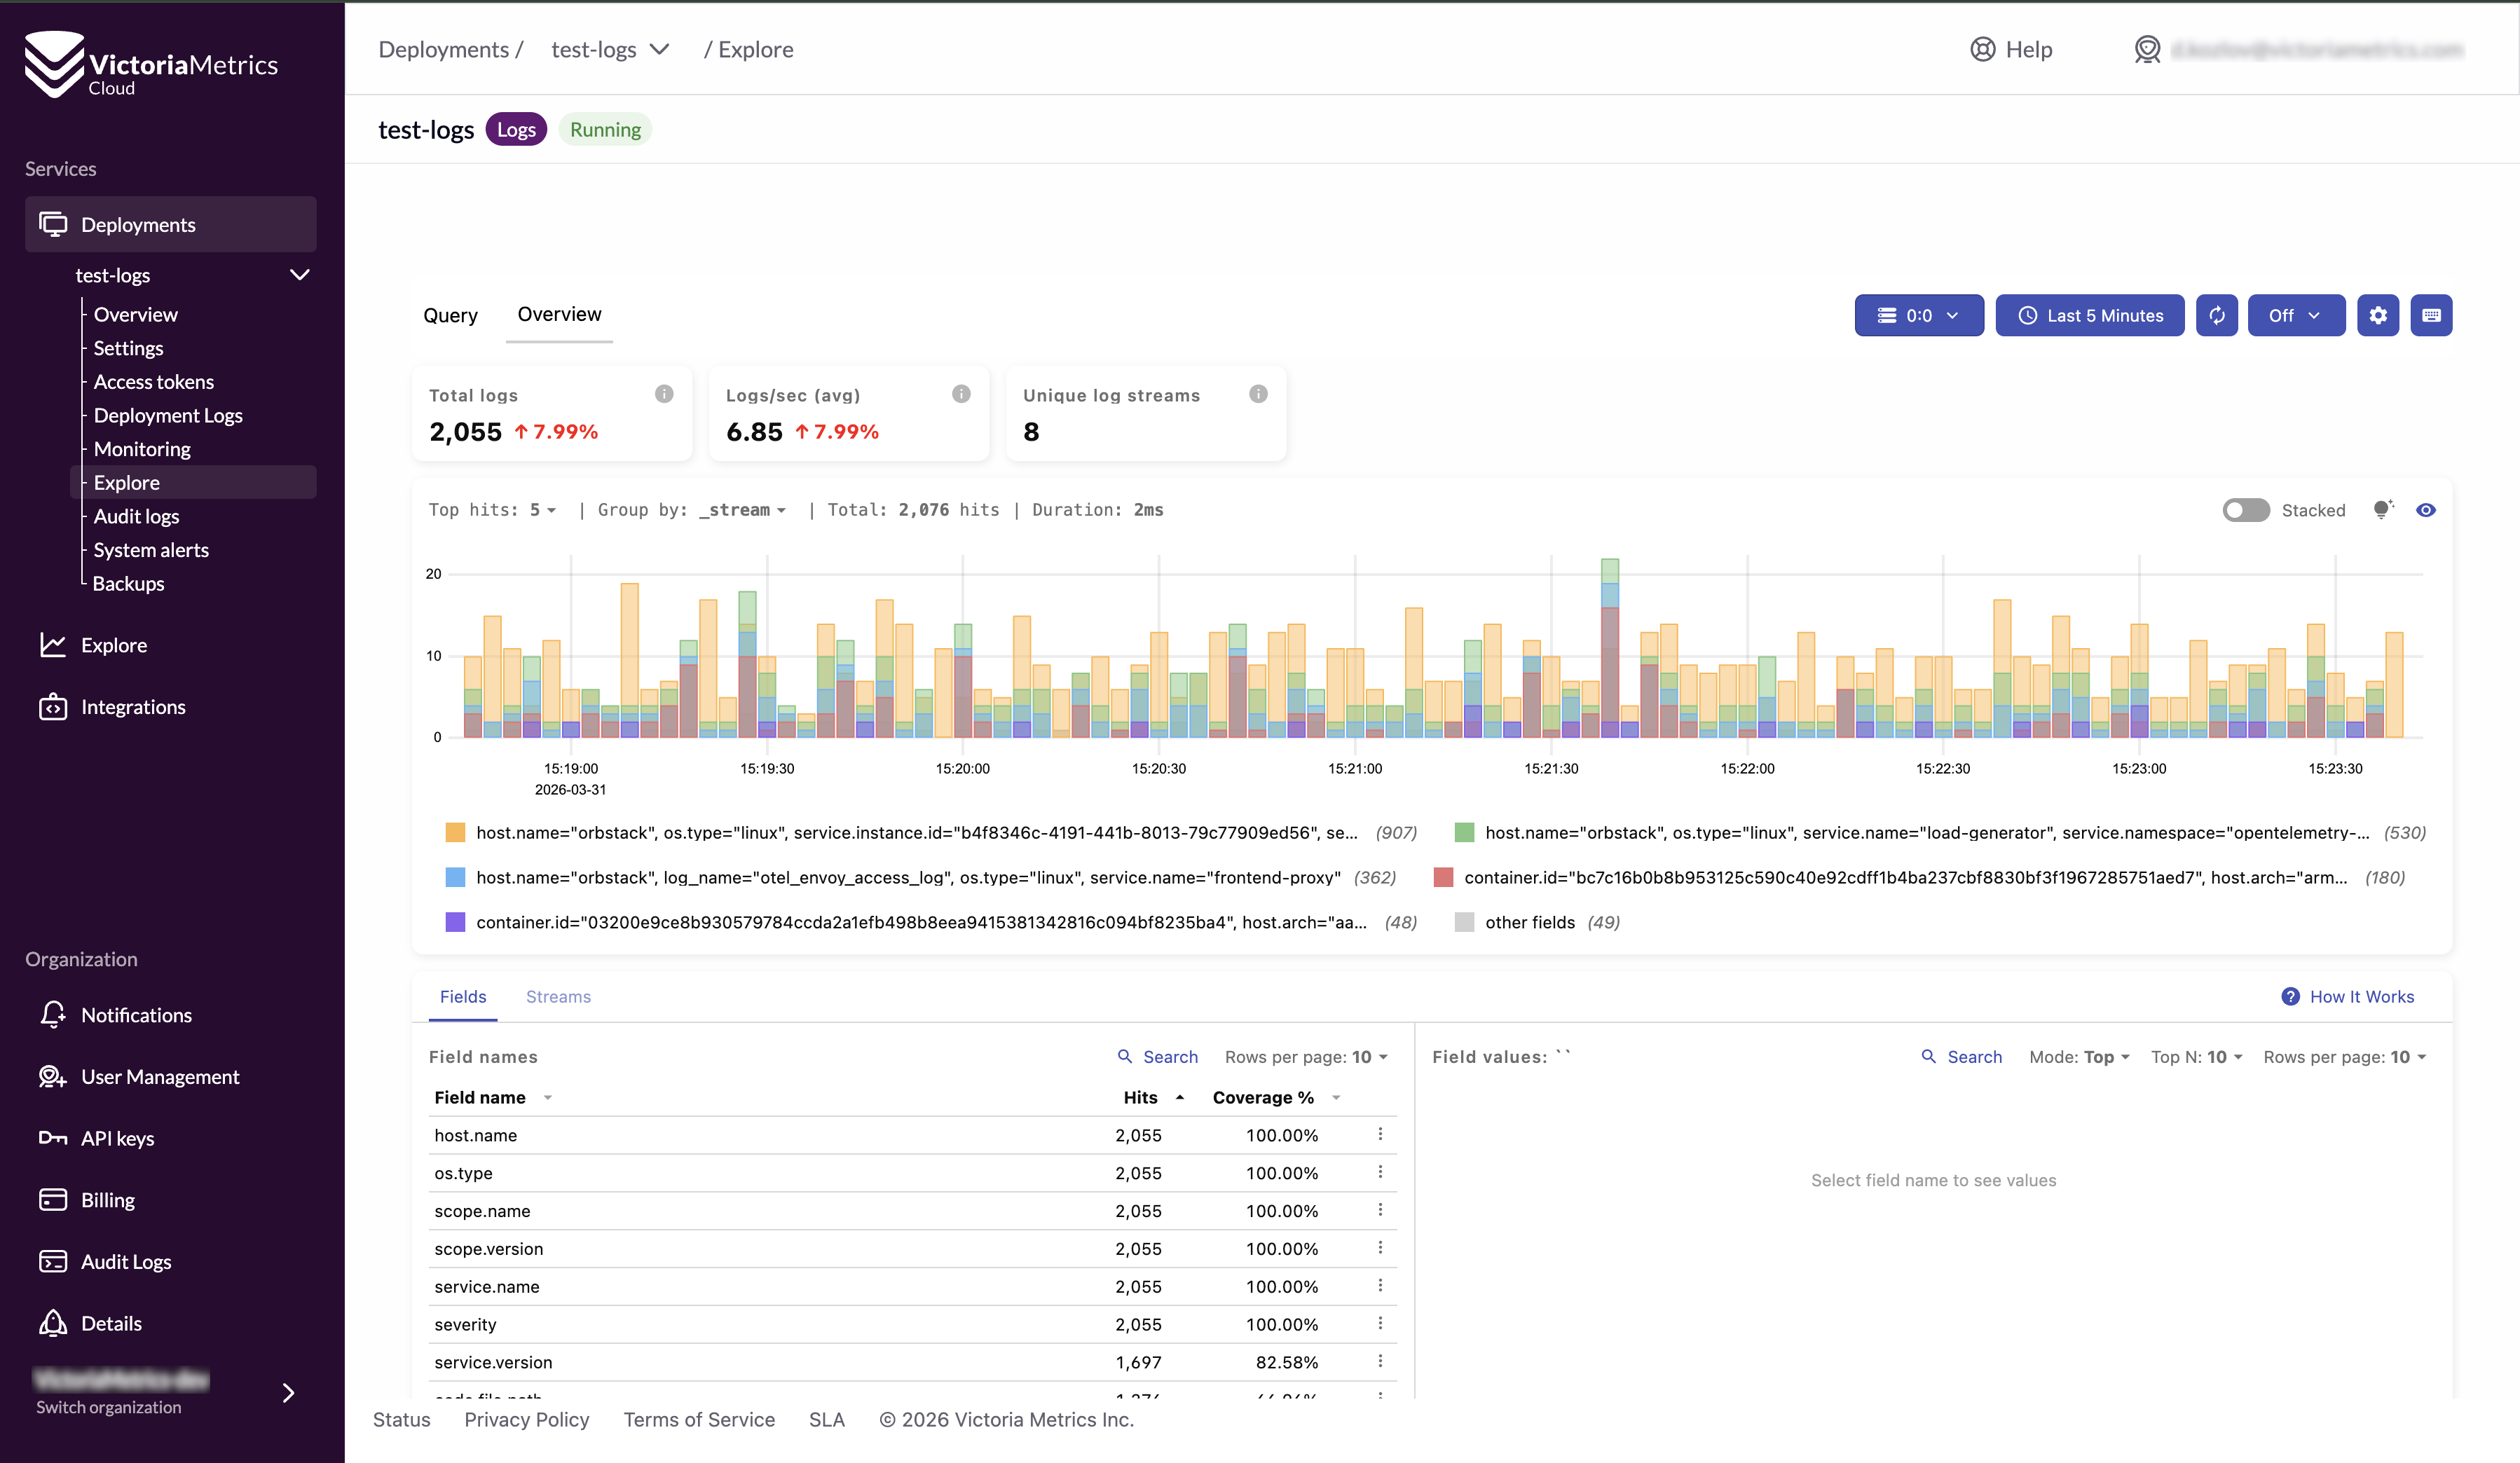
VMUI insights
Query and explore your logs, group them by streams, test complex queries, save your favorites, or overview your logs distribution at a glance

Downsampling & retention
Automatic downsampling policies plus configurable per-metric retention. Store what matters, at the resolution you need

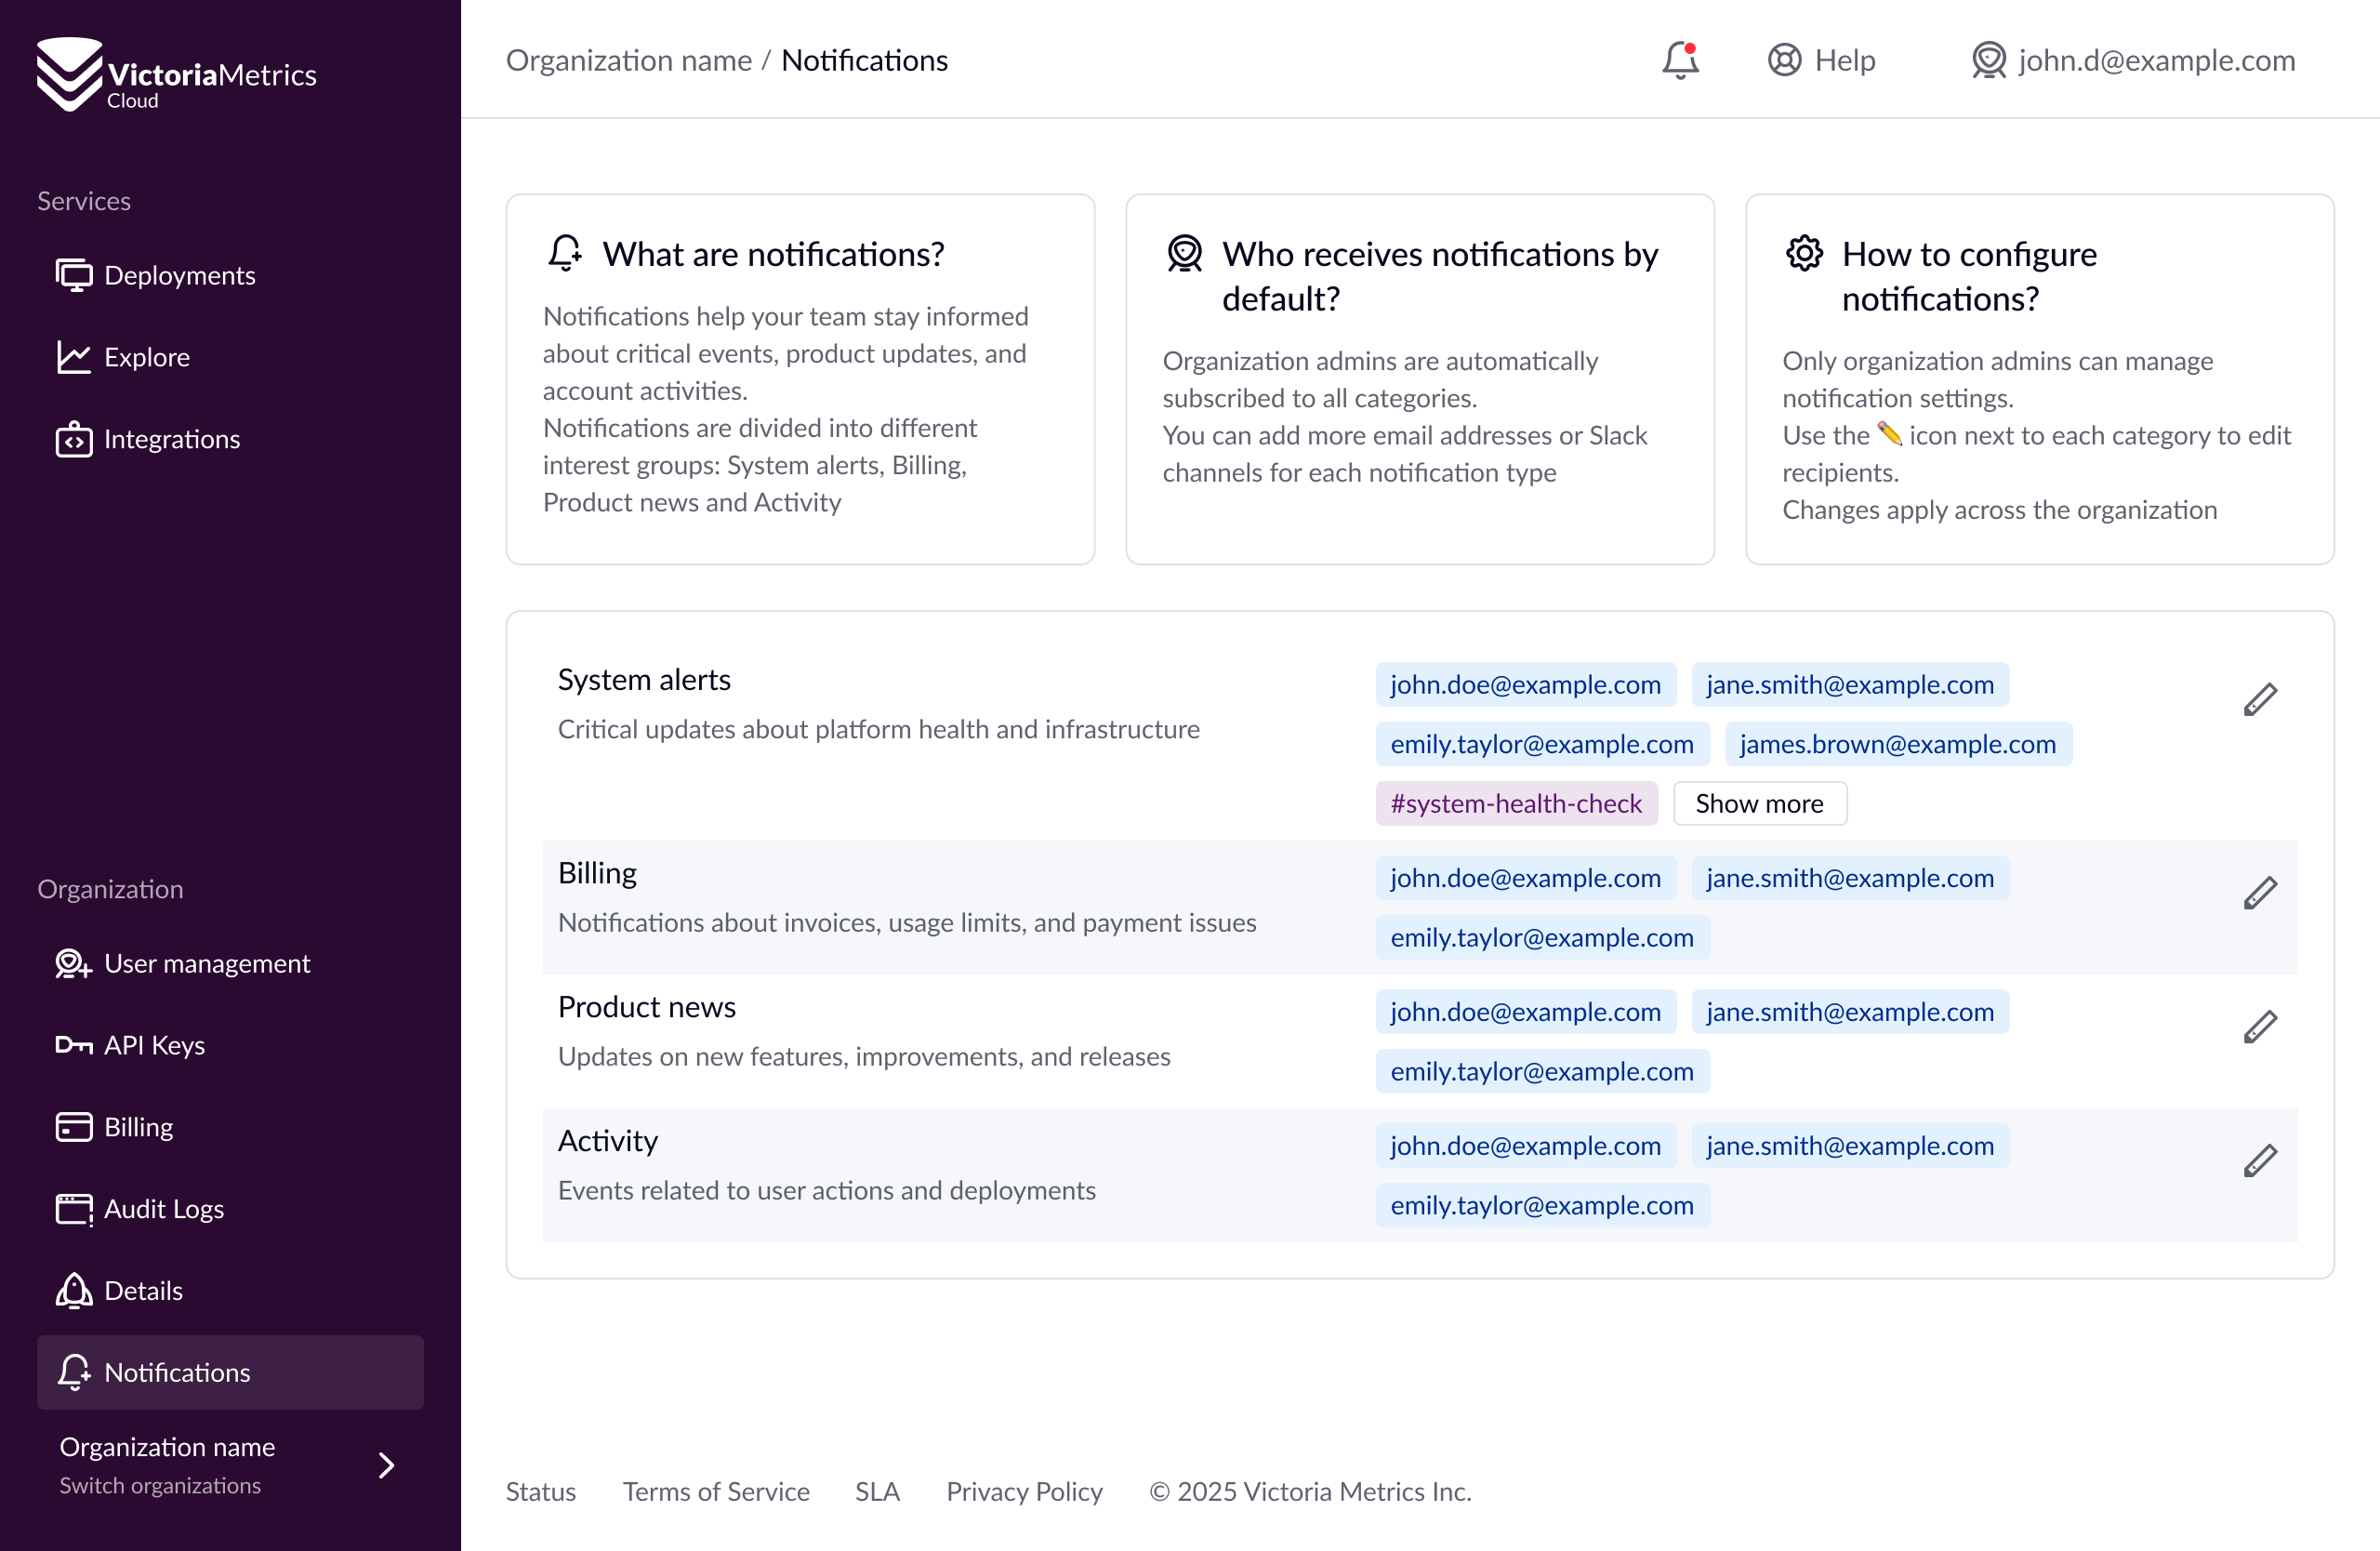
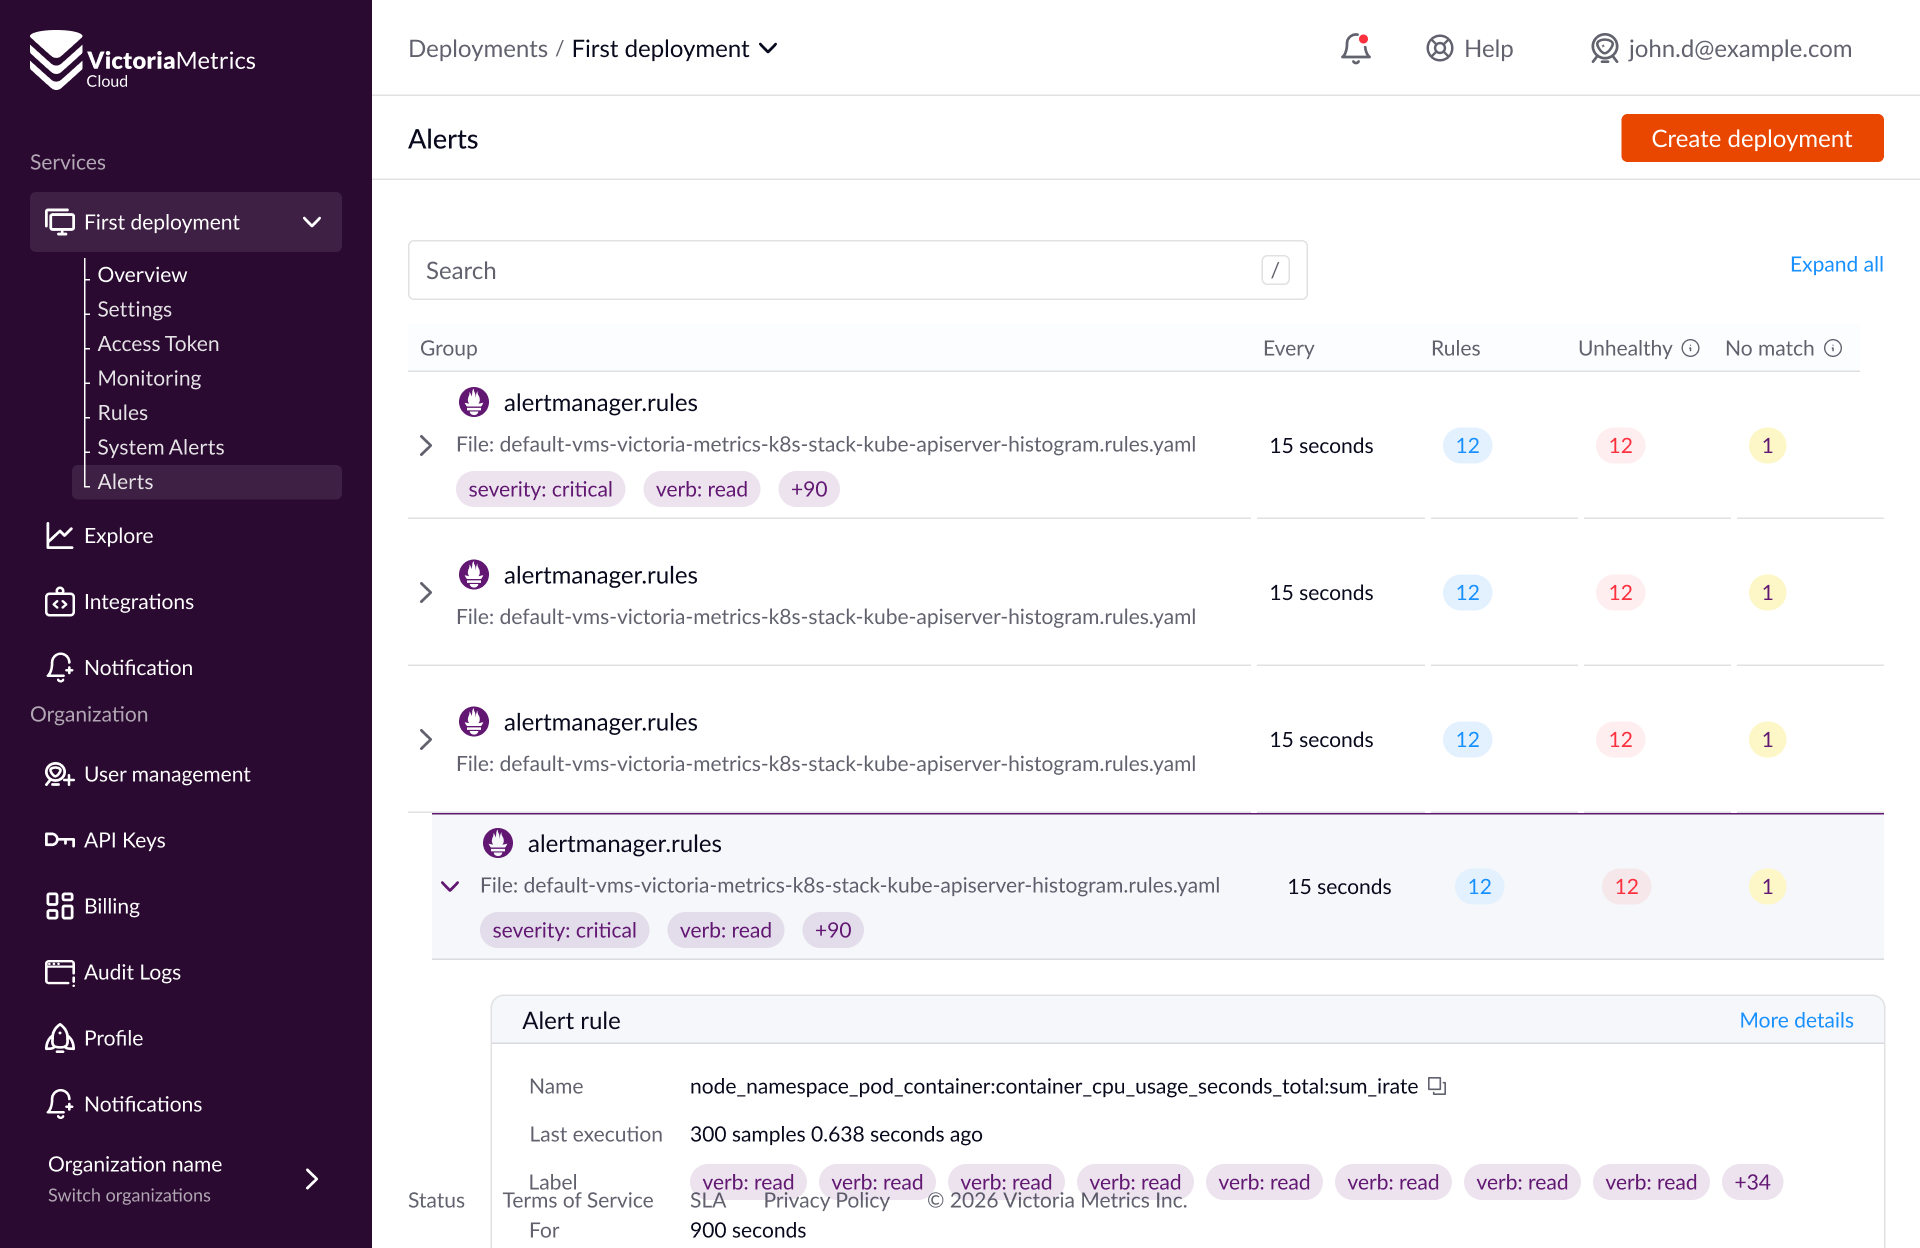
vmalert & Alertmanager
Define alerting and recording rules, route notifications via Alertmanager — fully integrated with your Cloud deployments

Reliable SLA
99.5% or 99.95% uptime SLA depending on your needs, with automated backups. Use the region of your choice
Our philosophy
Estimate your monthly cost
Defines how long data will be stored before deletion
Reduce costs further with Downsampling, Retention Filters, and Data Deduplication
Every database service presented here provide different features. Users are encouraged to compare the best solutions for their needs. All pricing data was gathered from the linked public sources as of April 1, 2026. Prices may change — if you spot anything incorrect, let us know.
Report an issueHow pricing works
Choose a Capacity Tier based on your data volume needs and desired retention
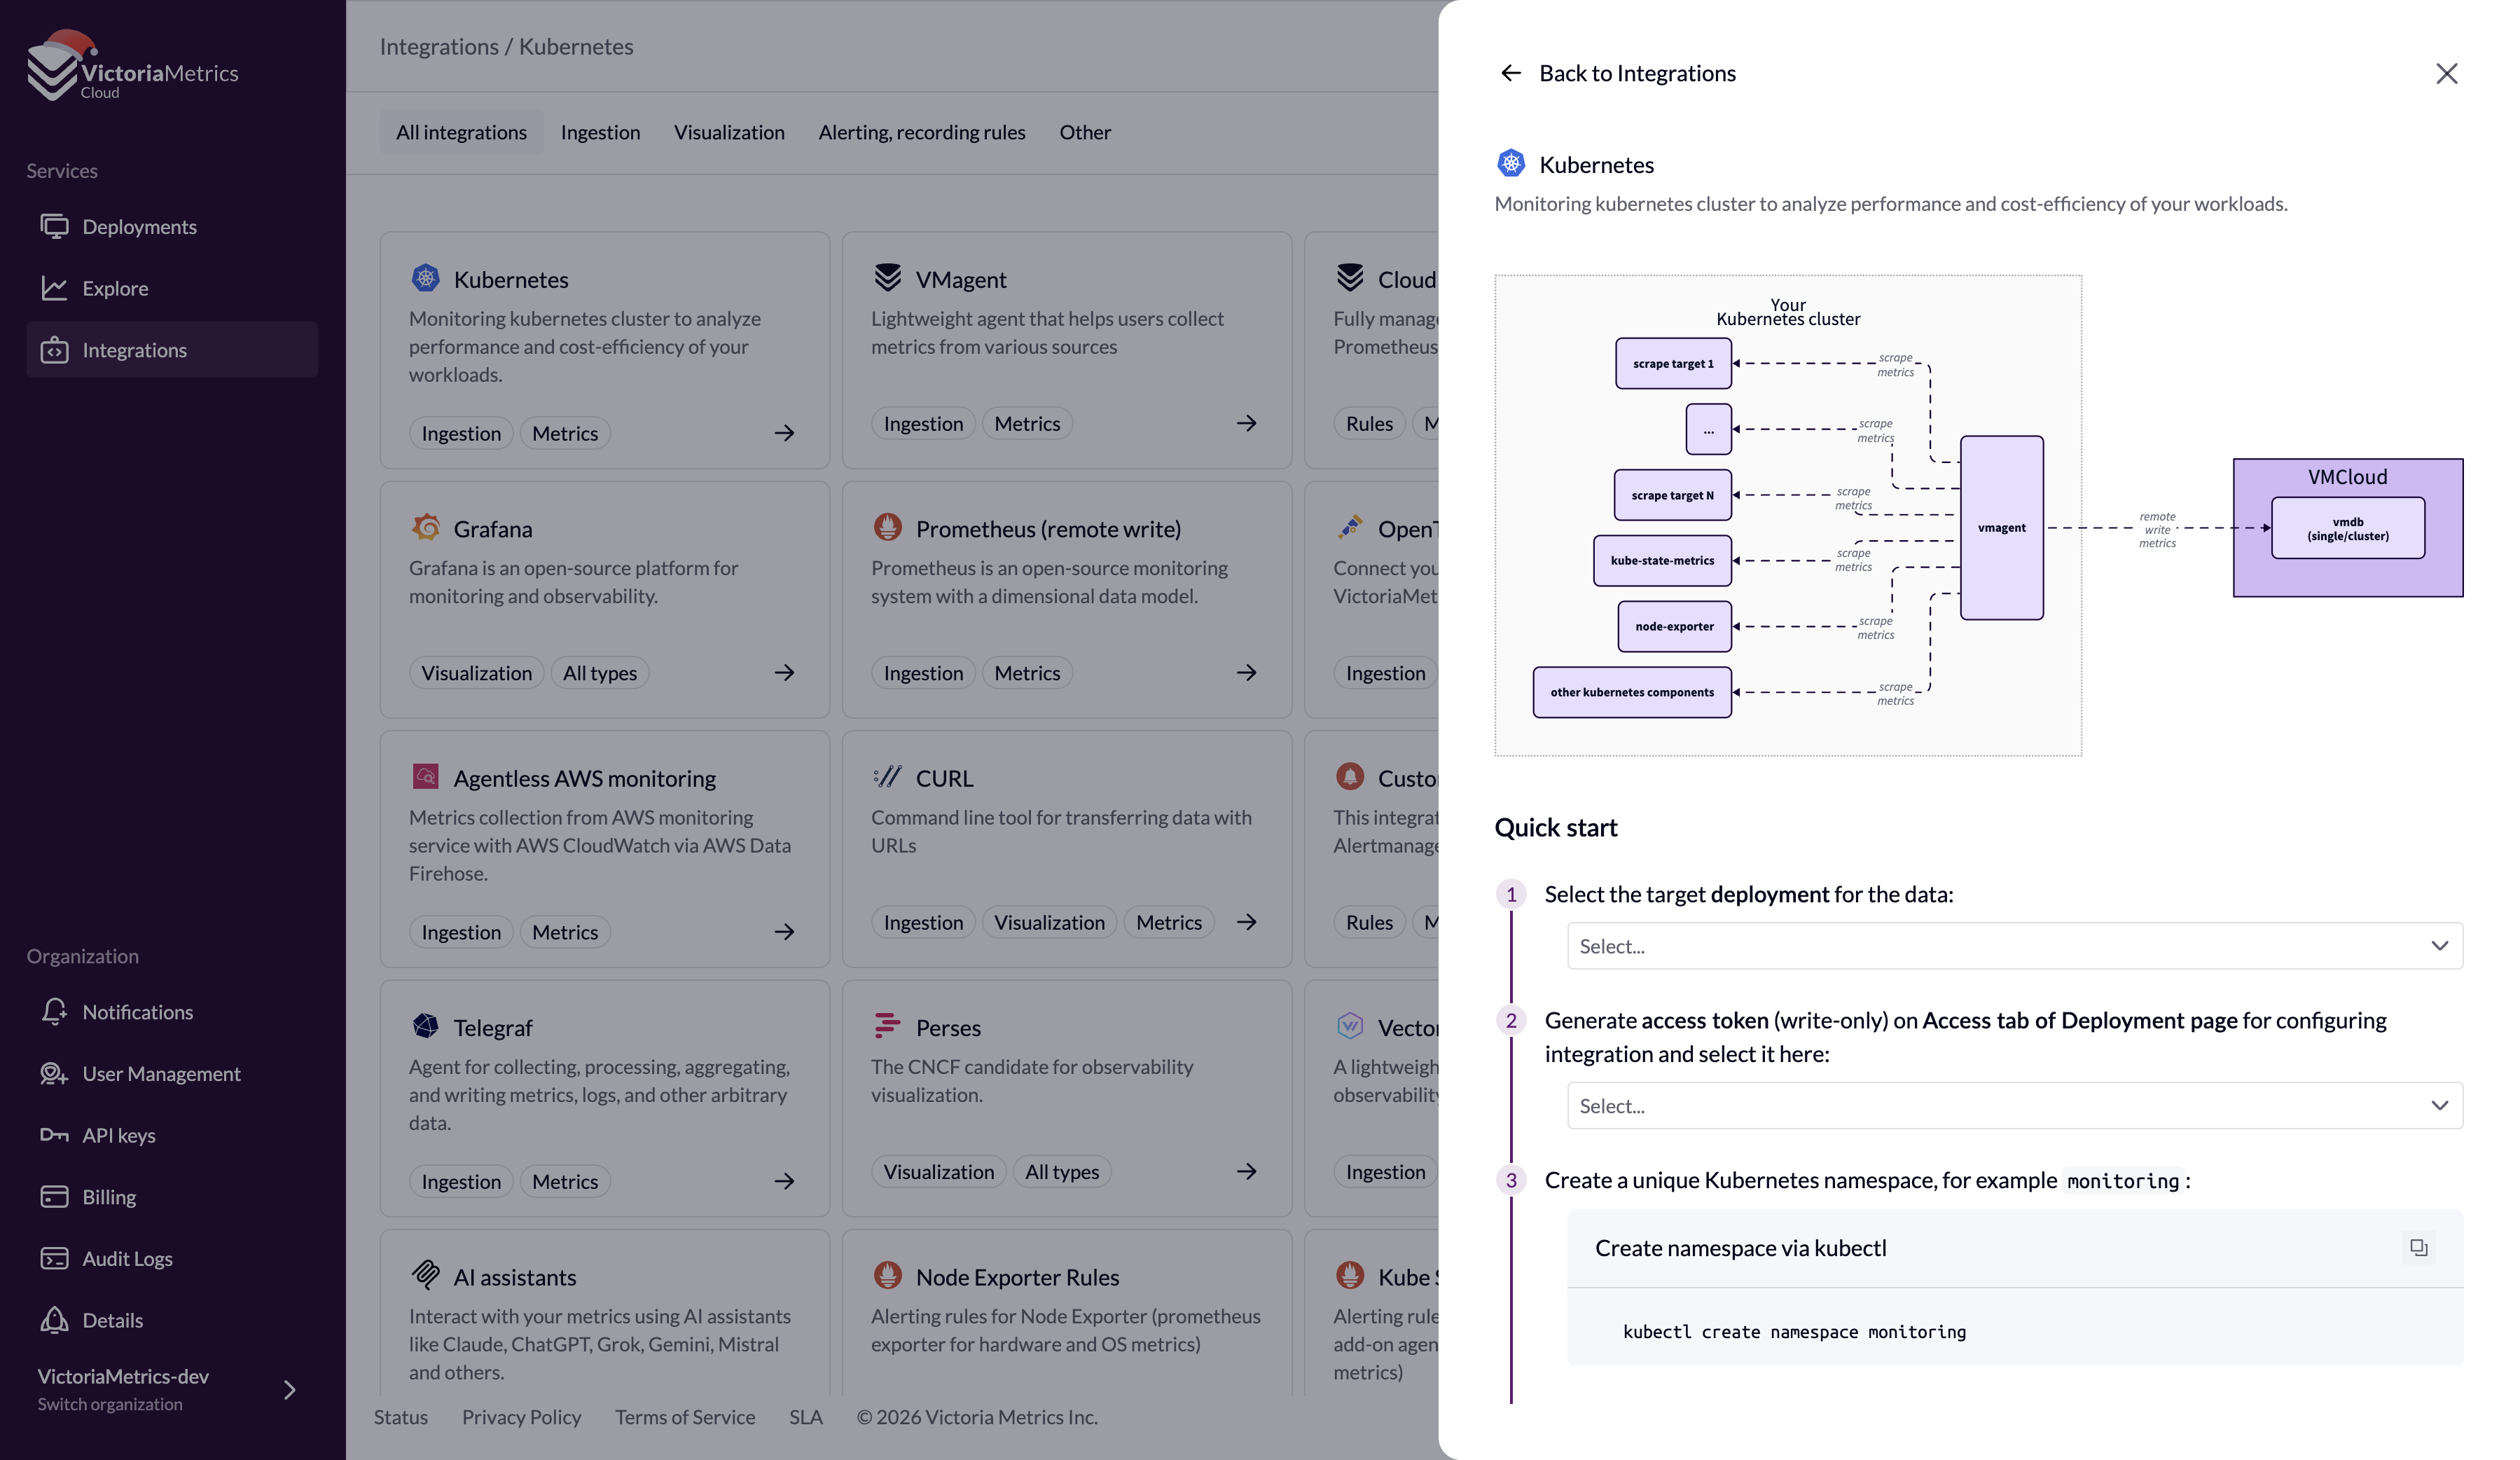
Integrations
Plug into your current observability stack instantly. VictoriaMetrics Cloud integrates with the tools you already run, so you can expand coverage without rebuilding your pipeline


Deploy close to your users
Run deployments in Asia Pacific, Europe, and the US to reduce query latency and meet data residency requirements

- Asia Pacific (Singapore)
- Europe (Frankfurt)
- Europe (Ireland)
- US East (N. Virginia)
- US East (Ohio)
Why teams trust VictoriaMetrics


Frequently asked questions
Have questions about our plans? Contact us
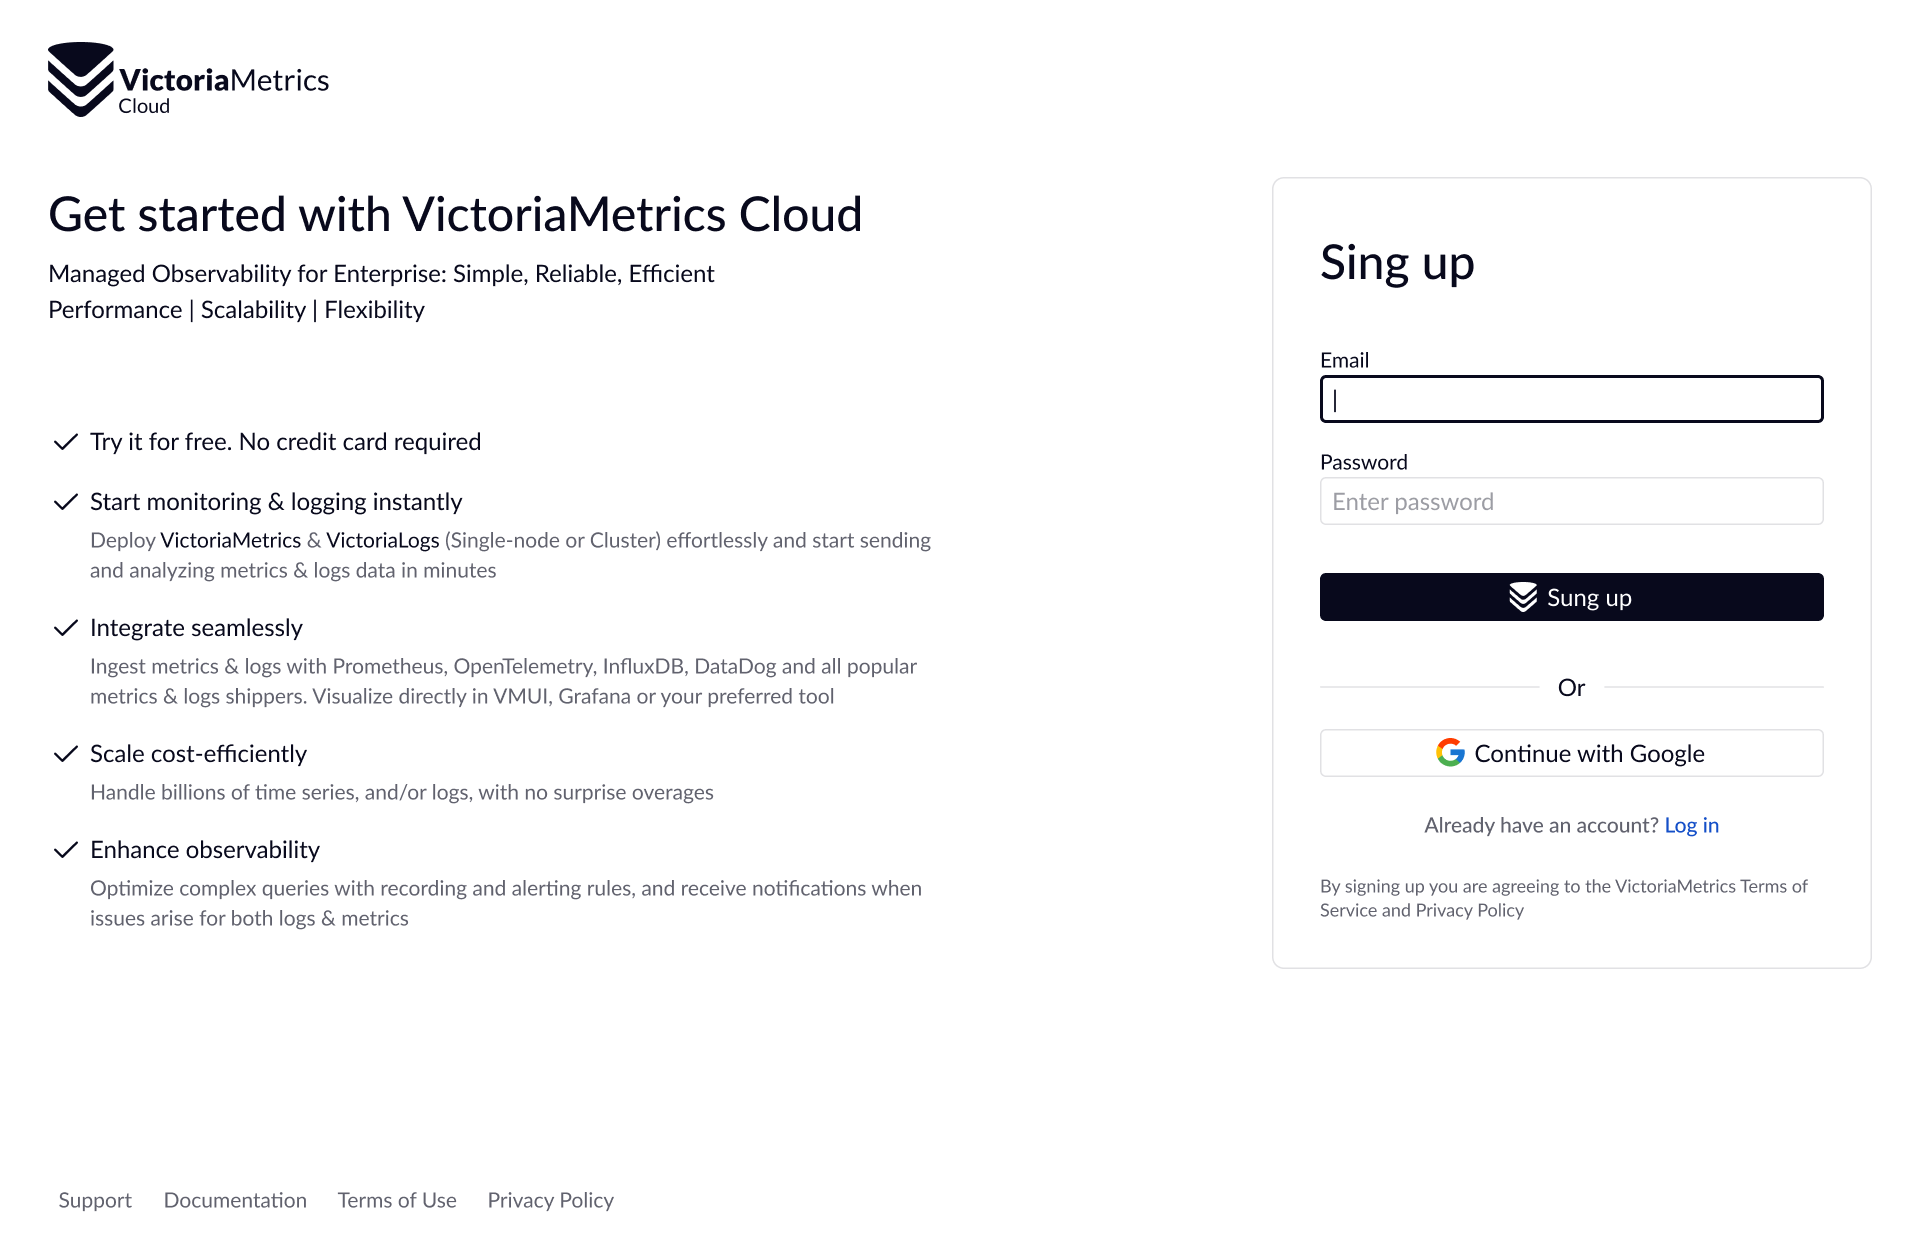
Ready to get started?
Sign up in under a minute. No credit card required. Start your 30-day free trial today